Download the documentation - True BASIC
Download the documentation - True BASIC
Download the documentation - True BASIC

Create successful ePaper yourself
Turn your PDF publications into a flip-book with our unique Google optimized e-Paper software.
T-tests and Confidence Intervals 51<br />
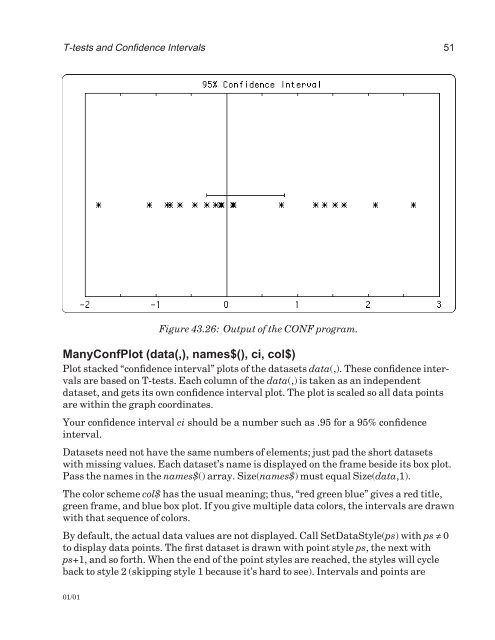
Figure 43.26: Output of <strong>the</strong> CONF program.<br />
ManyConfPlot (data(,), names$(), ci, col$)<br />
Plot stacked “confidence interval” plots of <strong>the</strong> datasets data(,). These confidence intervals<br />
are based on T-tests. Each column of <strong>the</strong> data(,) is taken as an independent<br />
dataset, and gets its own confidence interval plot. The plot is scaled so all data points<br />
are within <strong>the</strong> graph coordinates.<br />
Your confidence interval ci should be a number such as .95 for a 95% confidence<br />
interval.<br />
Datasets need not have <strong>the</strong> same numbers of elements; just pad <strong>the</strong> short datasets<br />
with missing values. Each dataset’s name is displayed on <strong>the</strong> frame beside its box plot.<br />
Pass <strong>the</strong> names in <strong>the</strong> names$() array. Size(names$) must equal Size(data,1).<br />
The color scheme col$ has <strong>the</strong> usual meaning; thus, “red green blue” gives a red title,<br />
green frame, and blue box plot. If you give multiple data colors, <strong>the</strong> intervals are drawn<br />
with that sequence of colors.<br />
By default, <strong>the</strong> actual data values are not displayed. Call SetDataStyle(ps) with ps ≠ 0<br />
to display data points. The first dataset is drawn with point style ps, <strong>the</strong> next with<br />
ps+1, and so forth. When <strong>the</strong> end of <strong>the</strong> point styles are reached, <strong>the</strong> styles will cycle<br />
back to style 2 (skipping style 1 because it’s hard to see). Intervals and points are<br />
01/01