CHAPTER 3 METHODOLOGY 3.1 Overview The Water Monitoring ...
CHAPTER 3 METHODOLOGY 3.1 Overview The Water Monitoring ...
CHAPTER 3 METHODOLOGY 3.1 Overview The Water Monitoring ...

You also want an ePaper? Increase the reach of your titles
YUMPU automatically turns print PDFs into web optimized ePapers that Google loves.
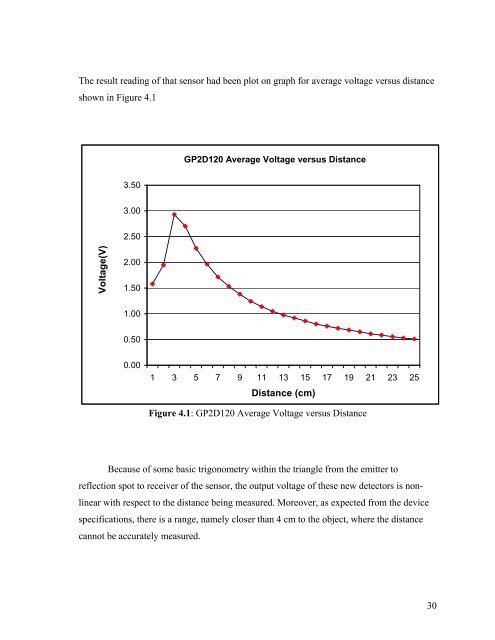
<strong>The</strong> result reading of that sensor had been plot on graph for average voltage versus distanceshown in Figure 4.1GP2D120 Average Voltage versus Distance3.503.002.50Voltage(V)2.001.501.000.500.001 3 5 7 9 11 13 15 17 19 21 23 25Distance (cm)Figure 4.1: GP2D120 Average Voltage versus DistanceBecause of some basic trigonometry within the triangle from the emitter toreflection spot to receiver of the sensor, the output voltage of these new detectors is nonlinearwith respect to the distance being measured. Moreover, as expected from the devicespecifications, there is a range, namely closer than 4 cm to the object, where the distancecannot be accurately measured.30