CHAPTER 3 METHODOLOGY 3.1 Overview The Water Monitoring ...
CHAPTER 3 METHODOLOGY 3.1 Overview The Water Monitoring ...
CHAPTER 3 METHODOLOGY 3.1 Overview The Water Monitoring ...

Create successful ePaper yourself
Turn your PDF publications into a flip-book with our unique Google optimized e-Paper software.
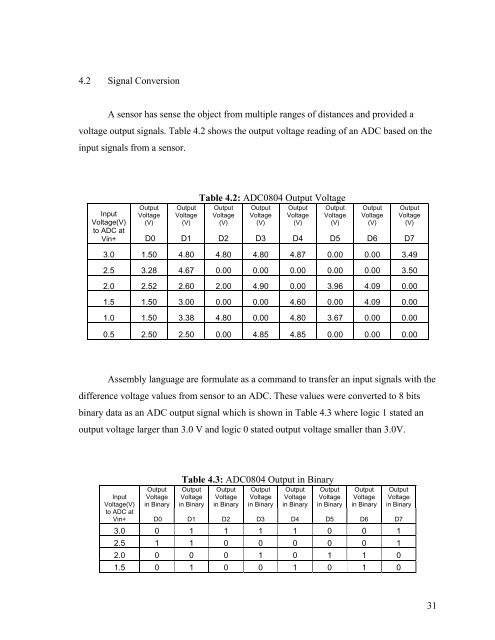
4.2 Signal ConversionA sensor has sense the object from multiple ranges of distances and provided avoltage output signals. Table 4.2 shows the output voltage reading of an ADC based on theinput signals from a sensor.OutputVoltage(V)OutputVoltage(V)Table 4.2: ADC0804 Output VoltageOutputVoltage(V)OutputVoltage(V)OutputVoltage(V)OutputVoltage(V)OutputVoltage(V)OutputVoltage(V)InputVoltage(V)to ADC atVin+ D0 D1 D2 D3 D4 D5 D6 D73.0 1.50 4.80 4.80 4.80 4.87 0.00 0.00 3.492.5 3.28 4.67 0.00 0.00 0.00 0.00 0.00 3.502.0 2.52 2.60 2.00 4.90 0.00 3.96 4.09 0.001.5 1.50 3.00 0.00 0.00 4.60 0.00 4.09 0.001.0 1.50 3.38 4.80 0.00 4.80 3.67 0.00 0.000.5 2.50 2.50 0.00 4.85 4.85 0.00 0.00 0.00Assembly language are formulate as a command to transfer an input signals with thedifference voltage values from sensor to an ADC. <strong>The</strong>se values were converted to 8 bitsbinary data as an ADC output signal which is shown in Table 4.3 where logic 1 stated anoutput voltage larger than 3.0 V and logic 0 stated output voltage smaller than 3.0V.OutputVoltagein BinaryTable 4.3: ADC0804 Output in BinaryOutputVoltagein BinaryOutputVoltagein BinaryOutputVoltagein BinaryOutputVoltagein BinaryOutputVoltagein BinaryOutputVoltagein BinaryOutputVoltagein BinaryInputVoltage(V)to ADC atVin+ D0 D1 D2 D3 D4 D5 D6 D73.0 0 1 1 1 1 0 0 12.5 1 1 0 0 0 0 0 12.0 0 0 0 1 0 1 1 01.5 0 1 0 0 1 0 1 031