Factors Influencing Visitor's Choices of Urban Destinations in North ...
Factors Influencing Visitor's Choices of Urban Destinations in North ...
Factors Influencing Visitor's Choices of Urban Destinations in North ...

Create successful ePaper yourself
Turn your PDF publications into a flip-book with our unique Google optimized e-Paper software.
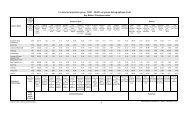
value below one suggests that the share <strong>of</strong> attractions for this city is below the <strong>North</strong>American average.H. Discussion <strong>of</strong> ResultsThe analysis proceeded <strong>in</strong> three steps to arrive to the set <strong>of</strong> five econometric models thatyielded robust results 10 . The structure <strong>of</strong> these models allowed Global Insight to identifyand rank the relative return <strong>of</strong>fered by each type <strong>of</strong> attraction <strong>in</strong> terms <strong>of</strong> the number <strong>of</strong>visitations it can generate. Based on these models, Global Insight can identify a subset <strong>of</strong>the most important attraction types for generat<strong>in</strong>g city visits. Furthermore, Global Insightcan recommend an effective attractions development and promotional tourism strategyfor Toronto and Ottawa to enhance future visitations. It is important to emphasize that allfive models were robust and conta<strong>in</strong>ed unique characteristicsKey F<strong>in</strong>d<strong>in</strong>gsStep 1: For this step, Global Insight used all three measures <strong>of</strong> attraction count. Leisurevisitations were regressed aga<strong>in</strong>st each <strong>of</strong> these measures <strong>of</strong> attraction count (i.e. number<strong>of</strong> attractions, normalized attractions, and normalized share <strong>of</strong> attractions) for each type<strong>of</strong> attraction, attraction category, and sub-category accord<strong>in</strong>g to the structure <strong>of</strong> theattractions matrix. Global Insight modelled total count <strong>of</strong> attractions and quality-ratedattractions (i.e. Q3, Q2, and Q1) separately. Table 12 summarizes our f<strong>in</strong>d<strong>in</strong>gs. In thistable, areas highlighted with dark colour represent statistically significant results with t-statistics above 2, while areas highlighted with light colour show marg<strong>in</strong>ally significantresults with t-statistics between 1 and 2 11 . Please note that the quality count <strong>of</strong> cas<strong>in</strong>os,opera, and theatre performances was not available. Conversely, the follow<strong>in</strong>g tablesummarizes the types <strong>of</strong> attractions, attraction categories, and sub-categories that did notwork for all three types <strong>of</strong> attraction measures.Note that there is a consistent statistical significance among all three attraction countmeasures for physical sett<strong>in</strong>g, urban amenities, built form, and popular enterta<strong>in</strong>ment. Inthis step, these categories and their related subcategories seemed to be the most highlycorrelated with leisure visitation, regardless <strong>of</strong> the attraction count measure used.10 These results were robust <strong>in</strong> terms <strong>of</strong> <strong>in</strong>dividual t-statistics for different types <strong>of</strong> tourist attractions andadjusted R 2 .11 t-statistics refer to a statistical “goodness-<strong>of</strong>-fit” measure that <strong>in</strong>dicated the likelihood that the coefficientestimated for the explanatory variable is, <strong>in</strong> fact, greater than 0. Thus, very low t-statistics suggest that thereis no mean<strong>in</strong>gful causation implied between the explanatory variable (the attractions variable) and the<strong>in</strong>dependent variable (the number <strong>of</strong> visitations). t-statistics greater than 2.0 are generally regarded ashighly significant.17


![THIS AGREEMENT made this [date], between [name of owner] (the ...](https://img.yumpu.com/49827605/1/158x260/this-agreement-made-this-date-between-name-of-owner-the-.jpg?quality=85)