Factors Influencing Visitor's Choices of Urban Destinations in North ...
Factors Influencing Visitor's Choices of Urban Destinations in North ...
Factors Influencing Visitor's Choices of Urban Destinations in North ...

You also want an ePaper? Increase the reach of your titles
YUMPU automatically turns print PDFs into web optimized ePapers that Google loves.
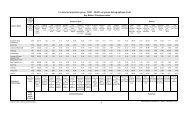
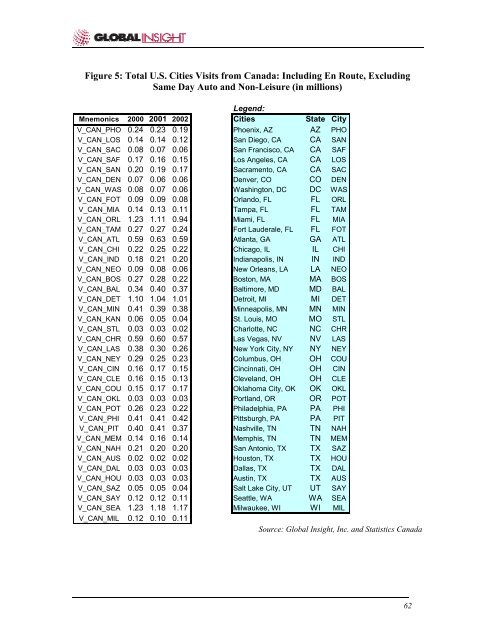
Figure 5: Total U.S. Cities Visits from Canada: Includ<strong>in</strong>g En Route, Exclud<strong>in</strong>gSame Day Auto and Non-Leisure (<strong>in</strong> millions)Legend:Mnemonics 2000 2001 2002 Cities State CityV_CAN_PHO 0.24 0.23 0.19 Phoenix, AZ AZ PHOV_CAN_LOS 0.14 0.14 0.12 San Diego, CA CA SANV_CAN_SAC 0.08 0.07 0.06 San Francisco, CA CA SAFV_CAN_SAF 0.17 0.16 0.15 Los Angeles, CA CA LOSV_CAN_SAN 0.20 0.19 0.17 Sacramento, CA CA SACV_CAN_DEN 0.07 0.06 0.06 Denver, CO CO DENV_CAN_WAS 0.08 0.07 0.06 Wash<strong>in</strong>gton, DC DC WASV_CAN_FOT 0.09 0.09 0.08 Orlando, FL FL ORLV_CAN_MIA 0.14 0.13 0.11 Tampa, FL FL TAMV_CAN_ORL 1.23 1.11 0.94 Miami, FL FL MIAV_CAN_TAM 0.27 0.27 0.24 Fort Lauderale, FL FL FOTV_CAN_ATL 0.59 0.63 0.59 Atlanta, GA GA ATLV_CAN_CHI 0.22 0.25 0.22 Chicago, IL IL CHIV_CAN_IND 0.18 0.21 0.20 Indianapolis, IN IN INDV_CAN_NEO 0.09 0.08 0.06 New Orleans, LA LA NEOV_CAN_BOS 0.27 0.28 0.22 Boston, MA MA BOSV_CAN_BAL 0.34 0.40 0.37 Baltimore, MD MD BALV_CAN_DET 1.10 1.04 1.01 Detroit, MI MI DETV_CAN_MIN 0.41 0.39 0.38 M<strong>in</strong>neapolis, MN MN MINV_CAN_KAN 0.06 0.05 0.04 St. Louis, MO MO STLV_CAN_STL 0.03 0.03 0.02 Charlotte, NC NC CHRV_CAN_CHR 0.59 0.60 0.57 Las Vegas, NV NV LASV_CAN_LAS 0.38 0.30 0.26 New York City, NY NY NEYV_CAN_NEY 0.29 0.25 0.23 Columbus, OH OH COUV_CAN_CIN 0.16 0.17 0.15 C<strong>in</strong>c<strong>in</strong>nati, OH OH CINV_CAN_CLE 0.16 0.15 0.13 Cleveland, OH OH CLEV_CAN_COU 0.15 0.17 0.17 Oklahoma City, OK OK OKLV_CAN_OKL 0.03 0.03 0.03 Portland, OR OR POTV_CAN_POT 0.26 0.23 0.22 Philadelphia, PA PA PHIV_CAN_PHI 0.41 0.41 0.42 Pittsburgh, PA PA PITV_CAN_PIT 0.40 0.41 0.37 Nashville, TN TN NAHV_CAN_MEM 0.14 0.16 0.14 Memphis, TN TN MEMV_CAN_NAH 0.21 0.20 0.20 San Antonio, TX TX SAZV_CAN_AUS 0.02 0.02 0.02 Houston, TX TX HOUV_CAN_DAL 0.03 0.03 0.03 Dallas, TX TX DALV_CAN_HOU 0.03 0.03 0.03 Aust<strong>in</strong>, TX TX AUSV_CAN_SAZ 0.05 0.05 0.04 Salt Lake City, UT UT SAYV_CAN_SAY 0.12 0.12 0.11 Seattle, WA WA SEAV_CAN_SEA 1.23 1.18 1.17 Milwaukee, WI WI MILV_CAN_MIL 0.12 0.10 0.11Source: Global Insight, Inc. and Statistics Canada62
![THIS AGREEMENT made this [date], between [name of owner] (the ...](https://img.yumpu.com/49827605/1/158x260/this-agreement-made-this-date-between-name-of-owner-the-.jpg?quality=85)