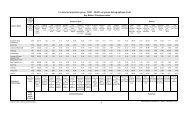
Figure 6: Cities Person-Trips Volume – Non-Visit<strong>in</strong>g Friends and Relatives Leisure(<strong>in</strong> millions)Legend:Mnemonics 1998 1999 2000 2001 2002 Cities State CityV_USA_PHO 4.38 4.79 4.61 4.57 4.84 Phoenix, AZ AZ PHOV_USA_LOS 7.25 8.56 7.64 8.34 8.56 San Diego, CA CA SANV_USA_SAC 3.89 4.12 4.37 4.31 4.50 San Francisco, CA CA SAFV_USA_SAF 7.60 8.42 9.03 9.79 10.07 Los Angeles, CA CA LOSV_USA_SAN 9.73 10.21 10.57 11.43 11.91 Sacramento, CA CA SACV_USA_DEN 4.01 4.35 4.73 5.11 5.54 Denver, CO CO DENV_USA_WAS 6.29 6.10 6.50 5.74 5.93 Wash<strong>in</strong>gton, DC DC WASV_USA_FOT 1.85 1.96 1.90 2.03 2.21 Orlando, FL FL ORLV_USA_MIA 2.63 2.74 2.89 2.84 3.06 Tampa, FL FL TAMV_USA_ORL 22.69 24.08 25.85 24.70 26.76 Miami, FL FL MIAV_USA_TAM 6.01 6.17 5.73 6.09 6.79 Fort Lauderale, FL FL FOTV_USA_ATL 9.77 9.50 9.42 9.66 9.94 Atlanta, GA GA ATLV_USA_CHI 9.93 10.33 11.22 9.62 9.84 Chicago, IL IL CHIV_USA_IND 6.37 6.22 6.48 7.03 7.10 Indianapolis, IN IN INDV_USA_NEO 5.61 6.97 7.16 6.04 6.49 New Orleans, LA LA NEOV_USA_BOS 5.54 6.12 5.46 5.72 6.17 Boston, MA MA BOSV_USA_BAL 5.37 4.96 4.74 5.08 5.09 Baltimore, MD MD BALV_USA_DET 1.75 1.76 1.88 2.07 2.16 Detroit, MI MI DETV_USA_MIN 4.83 4.77 5.02 5.06 4.77 M<strong>in</strong>neapolis, MN MN MINV_USA_KAN 3.76 4.07 3.98 3.97 4.28 St. Louis, MO MO STLV_USA_STL 6.61 7.01 7.04 7.45 7.76 Charlotte, NC NC CHRV_USA_CHR 4.22 4.23 4.63 4.94 5.36 Las Vegas, NV NV LASV_USA_LAS 17.15 18.11 18.82 17.92 18.85 New York City, NY NY NEYV_USA_NEY 13.07 13.67 14.36 14.78 16.17 Columbus, OH OH COUV_USA_CIN 4.45 4.93 5.40 5.23 5.07 C<strong>in</strong>c<strong>in</strong>nati, OH OH CINV_USA_CLE 4.47 4.97 5.46 4.85 4.44 Cleveland, OH OH CLEV_USA_COU 5.44 5.71 5.23 5.43 5.84 Oklahoma City, OK OK OKLV_USA_OKL 5.06 5.15 4.53 4.96 4.95 Portland, OR OR POTV_USA_POT 3.49 3.53 4.06 3.92 3.31 Philadelphia, PA PA PHIV_USA_PHI 5.74 5.48 5.00 5.00 5.23 Pittsburgh, PA PA PITV_USA_PIT 4.43 4.50 4.96 4.95 4.60 Nashville, TN TN NAHV_USA_MEM 3.74 4.08 4.37 4.85 4.54 Memphis, TN TN MEMV_USA_NAH 6.16 6.22 6.50 6.31 6.40 San Antonio, TX TX SAZV_USA_AUS 4.14 3.95 4.20 4.15 3.77 Houston, TX TX HOUV_USA_DAL 5.54 6.45 6.41 6.88 7.27 Dallas, TX TX DALV_USA_HOU 6.63 6.34 6.11 6.95 6.59 Aust<strong>in</strong>, TX TX AUSV_USA_SAZ 8.62 10.01 9.63 11.10 10.36 Salt Lake City, UT UT SAYV_USA_SAY 3.21 3.32 3.27 3.45 3.41 Seattle, WA WA SEAV_USA_SEA 4.26 3.68 3.74 4.01 3.64 Milwaukee, WI WI MILV_USA_MIL 3.06 3.22 3.10 3.23 3.38Source: D.K. Shifflet & Associates Ltd.63
E. Statistical ConceptsT-statistics: refers to a statistical “goodness-<strong>of</strong>-fit” measure that <strong>in</strong>dicated the likelihoodthat the coefficient estimated for the explanatory variable is, <strong>in</strong> fact, greater than 0. Thus,very low t-statistics suggest that there is no mean<strong>in</strong>gful causation implied between theexplanatory variable (the attractions variable) and the <strong>in</strong>dependent variable (the number<strong>of</strong> visitations). T-statistic greater than 2.0 are generally regarded as highly significant.Adjusted R-Squared: The R-squared <strong>in</strong>dicates the degree to which the variation <strong>of</strong> the<strong>in</strong>dependent variable (visitations) from its mean is expla<strong>in</strong>ed by the dependent variablesused <strong>in</strong> the regression. An adjusted R 2 value <strong>of</strong> 0.9 <strong>in</strong>dicates that 90% <strong>of</strong> the variation isexpla<strong>in</strong>ed.64


![THIS AGREEMENT made this [date], between [name of owner] (the ...](https://img.yumpu.com/49827605/1/158x260/this-agreement-made-this-date-between-name-of-owner-the-.jpg?quality=85)