Factors Influencing Visitor's Choices of Urban Destinations in North ...
Factors Influencing Visitor's Choices of Urban Destinations in North ...
Factors Influencing Visitor's Choices of Urban Destinations in North ...

Create successful ePaper yourself
Turn your PDF publications into a flip-book with our unique Google optimized e-Paper software.
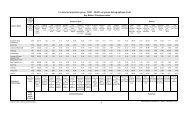
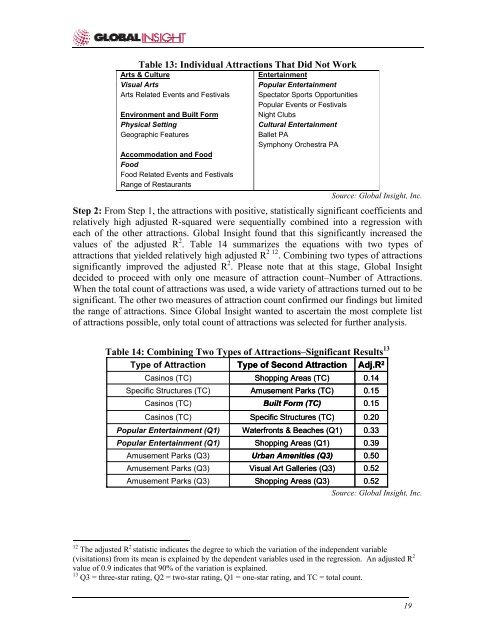
Table 13: Individual Attractions That Did Not WorkArts & CultureVisual ArtsArts Related Events and FestivalsEnvironment and Built FormPhysical Sett<strong>in</strong>gGeographic FeaturesAccommodation and FoodFoodFood Related Events and FestivalsRange <strong>of</strong> RestaurantsEnterta<strong>in</strong>mentPopular Enterta<strong>in</strong>mentSpectator Sports OpportunitiesPopular Events or FestivalsNight ClubsCultural Enterta<strong>in</strong>mentBallet PASymphony Orchestra PASource: Global Insight, Inc.Step 2: From Step 1, the attractions with positive, statistically significant coefficients andrelatively high adjusted R-squared were sequentially comb<strong>in</strong>ed <strong>in</strong>to a regression witheach <strong>of</strong> the other attractions. Global Insight found that this significantly <strong>in</strong>creased thevalues <strong>of</strong> the adjusted R 2 . Table 14 summarizes the equations with two types <strong>of</strong>attractions that yielded relatively high adjusted R 2 12 . Comb<strong>in</strong><strong>in</strong>g two types <strong>of</strong> attractionssignificantly improved the adjusted R 2 . Please note that at this stage, Global Insightdecided to proceed with only one measure <strong>of</strong> attraction count–Number <strong>of</strong> Attractions.When the total count <strong>of</strong> attractions was used, a wide variety <strong>of</strong> attractions turned out to besignificant. The other two measures <strong>of</strong> attraction count confirmed our f<strong>in</strong>d<strong>in</strong>gs but limitedthe range <strong>of</strong> attractions. S<strong>in</strong>ce Global Insight wanted to ascerta<strong>in</strong> the most complete list<strong>of</strong> attractions possible, only total count <strong>of</strong> attractions was selected for further analysis.Table 14: Comb<strong>in</strong><strong>in</strong>g Two Types <strong>of</strong> Attractions–Significant Results 13Type <strong>of</strong> AttractionType <strong>of</strong> Second AttractionAdj.R 2Cas<strong>in</strong>os (TC)Shopp<strong>in</strong>g Areas (TC)0.14Specific Structures (TC)Amusement Parks (TC)0.15Cas<strong>in</strong>os (TC)Built Form (TC)0.15Cas<strong>in</strong>os (TC)Specific Structures (TC)0.20Popular Enterta<strong>in</strong>ment (Q1)Waterfronts & Beaches (Q1)0.33Popular Enterta<strong>in</strong>ment (Q1)Amusement Parks (Q3)Shopp<strong>in</strong>g Areas (Q1)<strong>Urban</strong> Amenities (Q3)0.390.50Amusement Parks (Q3)Amusement Parks (Q3)Visual Art Galleries (Q3)Shopp<strong>in</strong>g Areas (Q3)0.520.52Source: Global Insight, Inc.12 The adjusted R 2 statistic <strong>in</strong>dicates the degree to which the variation <strong>of</strong> the <strong>in</strong>dependent variable(visitations) from its mean is expla<strong>in</strong>ed by the dependent variables used <strong>in</strong> the regression. An adjusted R 2value <strong>of</strong> 0.9 <strong>in</strong>dicates that 90% <strong>of</strong> the variation is expla<strong>in</strong>ed.13 Q3 = three-star rat<strong>in</strong>g, Q2 = two-star rat<strong>in</strong>g, Q1 = one-star rat<strong>in</strong>g, and TC = total count.19


![THIS AGREEMENT made this [date], between [name of owner] (the ...](https://img.yumpu.com/49827605/1/158x260/this-agreement-made-this-date-between-name-of-owner-the-.jpg?quality=85)