Factors Influencing Visitor's Choices of Urban Destinations in North ...
Factors Influencing Visitor's Choices of Urban Destinations in North ...
Factors Influencing Visitor's Choices of Urban Destinations in North ...

Create successful ePaper yourself
Turn your PDF publications into a flip-book with our unique Google optimized e-Paper software.
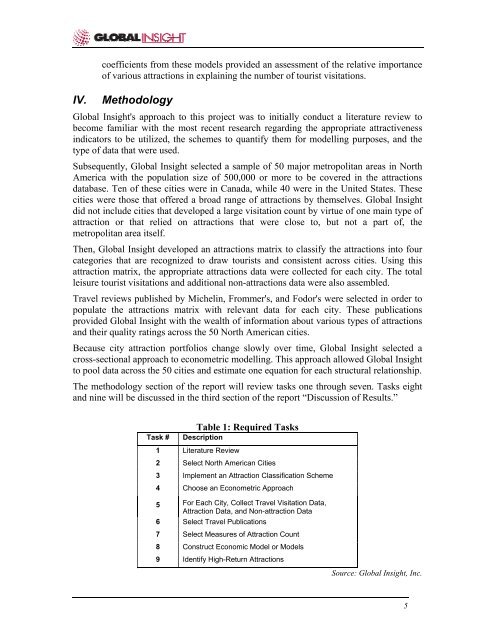
IV.coefficients from these models provided an assessment <strong>of</strong> the relative importance<strong>of</strong> various attractions <strong>in</strong> expla<strong>in</strong><strong>in</strong>g the number <strong>of</strong> tourist visitations.MethodologyGlobal Insight's approach to this project was to <strong>in</strong>itially conduct a literature review tobecome familiar with the most recent research regard<strong>in</strong>g the appropriate attractiveness<strong>in</strong>dicators to be utilized, the schemes to quantify them for modell<strong>in</strong>g purposes, and thetype <strong>of</strong> data that were used.Subsequently, Global Insight selected a sample <strong>of</strong> 50 major metropolitan areas <strong>in</strong> <strong>North</strong>America with the population size <strong>of</strong> 500,000 or more to be covered <strong>in</strong> the attractionsdatabase. Ten <strong>of</strong> these cities were <strong>in</strong> Canada, while 40 were <strong>in</strong> the United States. Thesecities were those that <strong>of</strong>fered a broad range <strong>of</strong> attractions by themselves. Global Insightdid not <strong>in</strong>clude cities that developed a large visitation count by virtue <strong>of</strong> one ma<strong>in</strong> type <strong>of</strong>attraction or that relied on attractions that were close to, but not a part <strong>of</strong>, themetropolitan area itself.Then, Global Insight developed an attractions matrix to classify the attractions <strong>in</strong>to fourcategories that are recognized to draw tourists and consistent across cities. Us<strong>in</strong>g thisattraction matrix, the appropriate attractions data were collected for each city. The totalleisure tourist visitations and additional non-attractions data were also assembled.Travel reviews published by Michel<strong>in</strong>, Frommer's, and Fodor's were selected <strong>in</strong> order topopulate the attractions matrix with relevant data for each city. These publicationsprovided Global Insight with the wealth <strong>of</strong> <strong>in</strong>formation about various types <strong>of</strong> attractionsand their quality rat<strong>in</strong>gs across the 50 <strong>North</strong> American cities.Because city attraction portfolios change slowly over time, Global Insight selected across-sectional approach to econometric modell<strong>in</strong>g. This approach allowed Global Insightto pool data across the 50 cities and estimate one equation for each structural relationship.The methodology section <strong>of</strong> the report will review tasks one through seven. Tasks eightand n<strong>in</strong>e will be discussed <strong>in</strong> the third section <strong>of</strong> the report “Discussion <strong>of</strong> Results.”Table 1: Required TasksTask # Description1 Literature Review2 Select <strong>North</strong> American Cities3 Implement an Attraction Classification Scheme4 Choose an Econometric Approach5 For Each City, Collect Travel Visitation Data,Attraction Data, and Non-attraction Data6 Select Travel Publications7 Select Measures <strong>of</strong> Attraction Count8 Construct Economic Model or Models9 Identify High-Return AttractionsSource: Global Insight, Inc.5


![THIS AGREEMENT made this [date], between [name of owner] (the ...](https://img.yumpu.com/49827605/1/158x260/this-agreement-made-this-date-between-name-of-owner-the-.jpg?quality=85)