Factors Influencing Visitor's Choices of Urban Destinations in North ...
Factors Influencing Visitor's Choices of Urban Destinations in North ...
Factors Influencing Visitor's Choices of Urban Destinations in North ...

Create successful ePaper yourself
Turn your PDF publications into a flip-book with our unique Google optimized e-Paper software.
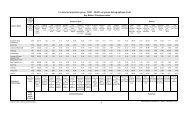
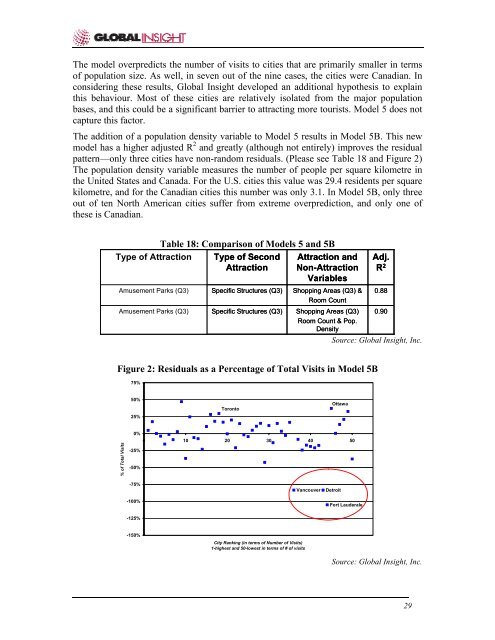
The model overpredicts the number <strong>of</strong> visits to cities that are primarily smaller <strong>in</strong> terms<strong>of</strong> population size. As well, <strong>in</strong> seven out <strong>of</strong> the n<strong>in</strong>e cases, the cities were Canadian. Inconsider<strong>in</strong>g these results, Global Insight developed an additional hypothesis to expla<strong>in</strong>this behaviour. Most <strong>of</strong> these cities are relatively isolated from the major populationbases, and this could be a significant barrier to attract<strong>in</strong>g more tourists. Model 5 does notcapture this factor.The addition <strong>of</strong> a population density variable to Model 5 results <strong>in</strong> Model 5B. This newmodel has a higher adjusted R 2 and greatly (although not entirely) improves the residualpattern—only three cities have non-random residuals. (Please see Table 18 and Figure 2)The population density variable measures the number <strong>of</strong> people per square kilometre <strong>in</strong>the United States and Canada. For the U.S. cities this value was 29.4 residents per squarekilometre, and for the Canadian cities this number was only 3.1. In Model 5B, only threeout <strong>of</strong> ten <strong>North</strong> American cities suffer from extreme overprediction, and only one <strong>of</strong>these is Canadian.Table 18: Comparison <strong>of</strong> Models 5 and 5BType <strong>of</strong> AttractionType <strong>of</strong> SecondAttraction andAttractionNon-AttractionVariablesAdj.Amusement Parks (Q3)Specific Structures (Q3)Shopp<strong>in</strong>g Areas (Q3) &Room Count0.88Amusement Parks (Q3)Specific Structures (Q3)Shopp<strong>in</strong>g Areas (Q3)Room Count & Pop.Density0.90Source: Global Insight, Inc.R 2Figure 2: Residuals as a Percentage <strong>of</strong> Total Visits <strong>in</strong> Model 5B75%50%25%TorontoOttawa% <strong>of</strong> Total Visits0%0 10 20 30 40 50-25%-50%-75%-100%VancouverDetroitFort Lauderale-125%-150%City Rank<strong>in</strong>g (<strong>in</strong> terms <strong>of</strong> Number <strong>of</strong> Visits)1-highest and 50-lowest <strong>in</strong> terms <strong>of</strong> # <strong>of</strong> visitsSource: Global Insight, Inc.29


![THIS AGREEMENT made this [date], between [name of owner] (the ...](https://img.yumpu.com/49827605/1/158x260/this-agreement-made-this-date-between-name-of-owner-the-.jpg?quality=85)