Factors Influencing Visitor's Choices of Urban Destinations in North ...
Factors Influencing Visitor's Choices of Urban Destinations in North ...
Factors Influencing Visitor's Choices of Urban Destinations in North ...

You also want an ePaper? Increase the reach of your titles
YUMPU automatically turns print PDFs into web optimized ePapers that Google loves.
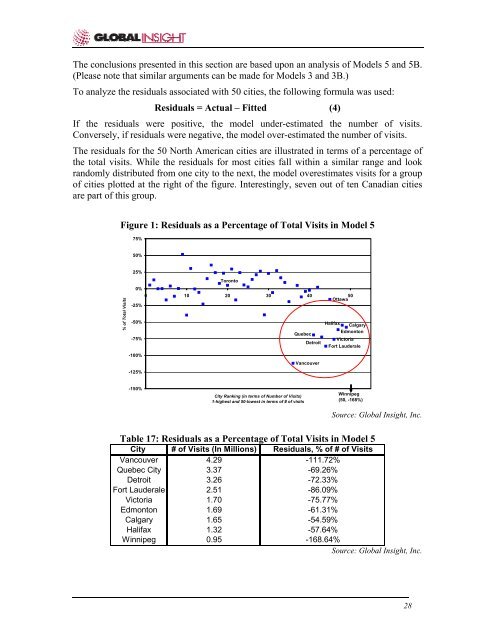
The conclusions presented <strong>in</strong> this section are based upon an analysis <strong>of</strong> Models 5 and 5B.(Please note that similar arguments can be made for Models 3 and 3B.)To analyze the residuals associated with 50 cities, the follow<strong>in</strong>g formula was used:Residuals = Actual – Fitted (4)If the residuals were positive, the model under-estimated the number <strong>of</strong> visits.Conversely, if residuals were negative, the model over-estimated the number <strong>of</strong> visits.The residuals for the 50 <strong>North</strong> American cities are illustrated <strong>in</strong> terms <strong>of</strong> a percentage <strong>of</strong>the total visits. While the residuals for most cities fall with<strong>in</strong> a similar range and lookrandomly distributed from one city to the next, the model overestimates visits for a group<strong>of</strong> cities plotted at the right <strong>of</strong> the figure. Interest<strong>in</strong>gly, seven out <strong>of</strong> ten Canadian citiesare part <strong>of</strong> this group.Figure 1: Residuals as a Percentage <strong>of</strong> Total Visits <strong>in</strong> Model 575%50%% <strong>of</strong> Total Visits25%0%Toronto0 10 20 30 40 50Ottawa-25%-50%-75%-100%-125%Halifax CalgaryQuebecDetroitEdmontonVictoriaFort LauderaleVancouver-150%City Rank<strong>in</strong>g (<strong>in</strong> terms <strong>of</strong> Number <strong>of</strong> Visits)1-highest and 50-lowest <strong>in</strong> terms <strong>of</strong> # <strong>of</strong> visitsW<strong>in</strong>nipeg(50, -168%)Source: Global Insight, Inc.Table 17: Residuals as a Percentage <strong>of</strong> Total Visits <strong>in</strong> Model 5City # <strong>of</strong> Visits (In Millions) Residuals, % <strong>of</strong> # <strong>of</strong> VisitsVancouver 4.29 -111.72%Quebec City 3.37 -69.26%Detroit 3.26 -72.33%Fort Lauderale 2.51 -86.09%Victoria 1.70 -75.77%Edmonton 1.69 -61.31%Calgary 1.65 -54.59%Halifax 1.32 -57.64%W<strong>in</strong>nipeg 0.95 -168.64%Source: Global Insight, Inc.28


![THIS AGREEMENT made this [date], between [name of owner] (the ...](https://img.yumpu.com/49827605/1/158x260/this-agreement-made-this-date-between-name-of-owner-the-.jpg?quality=85)