Factors Influencing Visitor's Choices of Urban Destinations in North ...
Factors Influencing Visitor's Choices of Urban Destinations in North ...
Factors Influencing Visitor's Choices of Urban Destinations in North ...

You also want an ePaper? Increase the reach of your titles
YUMPU automatically turns print PDFs into web optimized ePapers that Google loves.
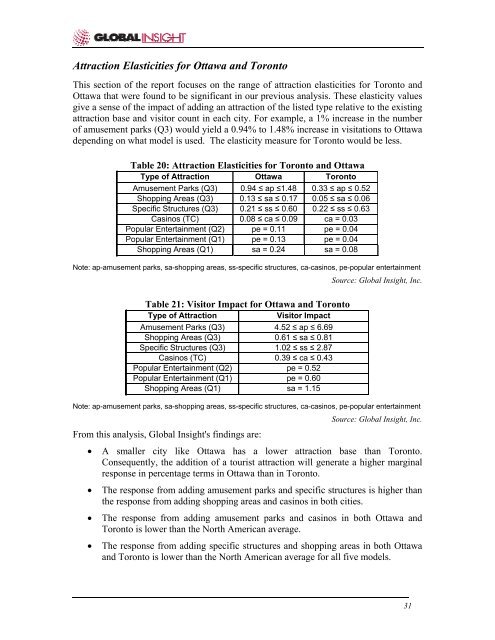
Attraction Elasticities for Ottawa and TorontoThis section <strong>of</strong> the report focuses on the range <strong>of</strong> attraction elasticities for Toronto andOttawa that were found to be significant <strong>in</strong> our previous analysis. These elasticity valuesgive a sense <strong>of</strong> the impact <strong>of</strong> add<strong>in</strong>g an attraction <strong>of</strong> the listed type relative to the exist<strong>in</strong>gattraction base and visitor count <strong>in</strong> each city. For example, a 1% <strong>in</strong>crease <strong>in</strong> the number<strong>of</strong> amusement parks (Q3) would yield a 0.94% to 1.48% <strong>in</strong>crease <strong>in</strong> visitations to Ottawadepend<strong>in</strong>g on what model is used. The elasticity measure for Toronto would be less.Table 20: Attraction Elasticities for Toronto and OttawaType <strong>of</strong> Attraction Ottawa TorontoAmusement Parks (Q3) 0.94 ≤ ap ≤1.48 0.33 ≤ ap ≤ 0.52Shopp<strong>in</strong>g Areas (Q3) 0.13 ≤ sa ≤ 0.17 0.05 ≤ sa ≤ 0.06Specific Structures (Q3) 0.21 ≤ ss ≤ 0.60 0.22 ≤ ss ≤ 0.63Cas<strong>in</strong>os (TC) 0.08 ≤ ca ≤ 0.09 ca = 0.03Popular Enterta<strong>in</strong>ment (Q2) pe = 0.11 pe = 0.04Popular Enterta<strong>in</strong>ment (Q1) pe = 0.13 pe = 0.04Shopp<strong>in</strong>g Areas (Q1) sa = 0.24 sa = 0.08Note: ap-amusement parks, sa-shopp<strong>in</strong>g areas, ss-specific structures, ca-cas<strong>in</strong>os, pe-popular enterta<strong>in</strong>mentSource: Global Insight, Inc.Table 21: Visitor Impact for Ottawa and TorontoType <strong>of</strong> AttractionVisitor ImpactAmusement Parks (Q3) 4.52 ≤ ap ≤ 6.69Shopp<strong>in</strong>g Areas (Q3) 0.61 ≤ sa ≤ 0.81Specific Structures (Q3) 1.02 ≤ ss ≤ 2.87Cas<strong>in</strong>os (TC) 0.39 ≤ ca ≤ 0.43Popular Enterta<strong>in</strong>ment (Q2) pe = 0.52Popular Enterta<strong>in</strong>ment (Q1) pe = 0.60Shopp<strong>in</strong>g Areas (Q1) sa = 1.15Note: ap-amusement parks, sa-shopp<strong>in</strong>g areas, ss-specific structures, ca-cas<strong>in</strong>os, pe-popular enterta<strong>in</strong>mentSource: Global Insight, Inc.From this analysis, Global Insight's f<strong>in</strong>d<strong>in</strong>gs are:• A smaller city like Ottawa has a lower attraction base than Toronto.Consequently, the addition <strong>of</strong> a tourist attraction will generate a higher marg<strong>in</strong>alresponse <strong>in</strong> percentage terms <strong>in</strong> Ottawa than <strong>in</strong> Toronto.• The response from add<strong>in</strong>g amusement parks and specific structures is higher thanthe response from add<strong>in</strong>g shopp<strong>in</strong>g areas and cas<strong>in</strong>os <strong>in</strong> both cities.• The response from add<strong>in</strong>g amusement parks and cas<strong>in</strong>os <strong>in</strong> both Ottawa andToronto is lower than the <strong>North</strong> American average.• The response from add<strong>in</strong>g specific structures and shopp<strong>in</strong>g areas <strong>in</strong> both Ottawaand Toronto is lower than the <strong>North</strong> American average for all five models.31


![THIS AGREEMENT made this [date], between [name of owner] (the ...](https://img.yumpu.com/49827605/1/158x260/this-agreement-made-this-date-between-name-of-owner-the-.jpg?quality=85)