Land Use 2025 - RhodeMap RI
Land Use 2025 - RhodeMap RI
Land Use 2025 - RhodeMap RI
- No tags were found...

You also want an ePaper? Increase the reach of your titles
YUMPU automatically turns print PDFs into web optimized ePapers that Google loves.
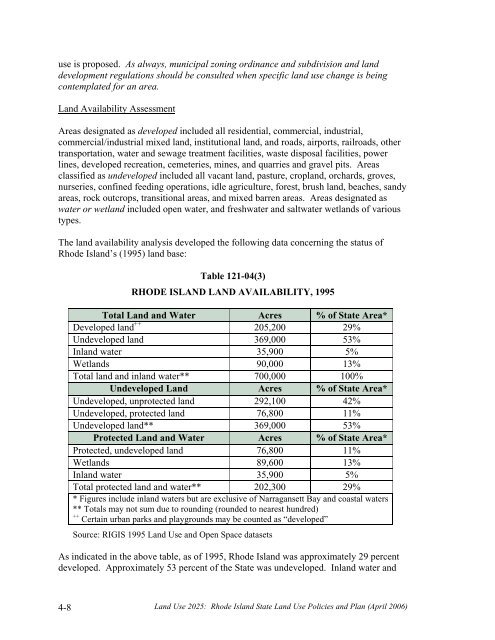
use is proposed. As always, municipal zoning ordinance and subdivision and landdevelopment regulations should be consulted when specific land use change is beingcontemplated for an area.<strong>Land</strong> Availability AssessmentAreas designated as developed included all residential, commercial, industrial,commercial/industrial mixed land, institutional land, and roads, airports, railroads, othertransportation, water and sewage treatment facilities, waste disposal facilities, powerlines, developed recreation, cemeteries, mines, and quarries and gravel pits. Areasclassified as undeveloped included all vacant land, pasture, cropland, orchards, groves,nurseries, confined feeding operations, idle agriculture, forest, brush land, beaches, sandyareas, rock outcrops, transitional areas, and mixed barren areas. Areas designated aswater or wetland included open water, and freshwater and saltwater wetlands of varioustypes.The land availability analysis developed the following data concerning the status ofRhode Island’s (1995) land base:Table 121-04(3)RHODE ISLAND LAND AVAILABILITY, 1995Total <strong>Land</strong> and Water Acres % of State Area*Developed land ++ 205,200 29%Undeveloped land 369,000 53%Inland water 35,900 5%Wetlands 90,000 13%Total land and inland water** 700,000 100%Undeveloped <strong>Land</strong> Acres % of State Area*Undeveloped, unprotected land 292,100 42%Undeveloped, protected land 76,800 11%Undeveloped land** 369,000 53%Protected <strong>Land</strong> and Water Acres % of State Area*Protected, undeveloped land 76,800 11%Wetlands 89,600 13%Inland water 35,900 5%Total protected land and water** 202,300 29%* Figures include inland waters but are exclusive of Narragansett Bay and coastal waters** Totals may not sum due to rounding (rounded to nearest hundred)++ Certain urban parks and playgrounds may be counted as “developed”Source: <strong>RI</strong>GIS 1995 <strong>Land</strong> <strong>Use</strong> and Open Space datasetsAs indicated in the above table, as of 1995, Rhode Island was approximately 29 percentdeveloped. Approximately 53 percent of the State was undeveloped. Inland water and4-8<strong>Land</strong> <strong>Use</strong> <strong>2025</strong>: Rhode Island State <strong>Land</strong> <strong>Use</strong> Policies and Plan (April 2006)