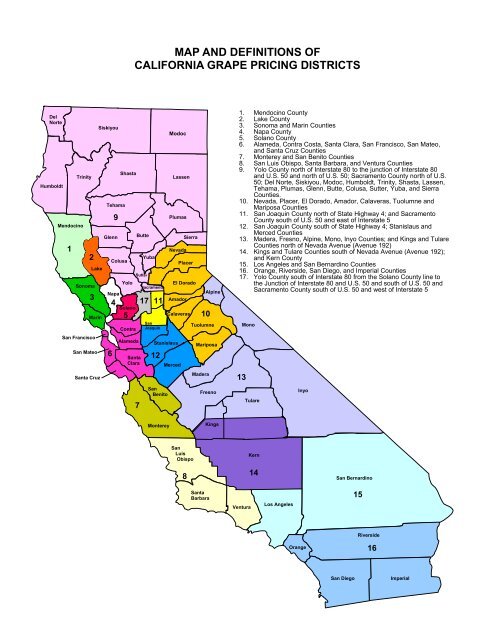
MAP AND DEFINITIONS OFCALIFORNIA GRAPE PRICING DISTRICTSDelNorteHumboldtMendocino1TrinitySan FranciscoSan MateoSiskiyouTehamaGlennShastaButteModocLassenPlumasSierraNevada2YubaColusaPlacerLakeSutterYoloEl DoradoSonomaSacramentoNapaAlpine3Amador4 17 11SolanoCalaveras 10Marin 5SanTuolumneContra JoaquinSanta Cruz69AlamedaSantaClara7Stanislaus12SanBenitoMercedMariposaMaderaFresno1. Mendocino County2. Lake County3. Sonoma and Marin Counties4. Napa County5. Solano County6. Alameda, Contra Costa, Santa Clara, San Francisco, San Mateo,and Santa Cruz Counties7. Monterey and San Benito Counties8. San Luis Obispo, Santa Barbara, and Ventura Counties9. Yolo County north of Interstate 80 to the junction of Interstate 80and U.S. 50 and north of U.S. 50; Sacramento County north of U.S.50; Del Norte, Siskiyou, Modoc, Humboldt, Trinity, Shasta, Lassen,Tehama, Plumas, Glenn, Butte, Colusa, Sutter, Yuba, and SierraCounties.10. Nevada, Placer, El Dorado, Amador, Calaveras, Tuolumne andMariposa Counties11. San Joaquin County north of State Highway 4; and SacramentoCounty south of U.S. 50 and east of Interstate 512. San Joaquin County south of State Highway 4; Stanislaus andMerced Counties13. Madera, Fresno, Alpine, Mono, Inyo Counties; and Kings and TulareCounties north of Nevada Avenue (Avenue 192)14. Kings and Tulare Counties south of Nevada Avenue (Avenue 192);and Kern County15. Los Angeles and San Bernardino Counties16. Orange, Riverside, San Diego, and Imperial Counties17. Yolo County south of Interstate 80 from the Solano County line tothe Junction of Interstate 80 and U.S. 50 and south of U.S. 50 andSacramento County south of U.S. 50 and west of Interstate 513MonoTulareInyoMontereyKingsSanLuisObispoKern814San BernardinoSantaBarbaraVenturaLos Angeles15RiversideOrange16San DiegoImperial
TABLE OF CONTENTSGRAPE CRUSH REPORT OVERVIEW ................................................................................................................ 1EXPLANATION OF TABLES ................................................................................................................................. 4TABLE 1:TABLE 2:TABLE 3:TABLE 4:TABLE 5:TABLE 6:<strong>Grape</strong>s for <strong>Crush</strong>ing: State totals by type and variety, weighted average degrees Brix, andweighted average dollars per ton, 2009-10 ....................................................................................... 6Tons of grapes crushed by California processors from the <strong>2010</strong> crop by type, variety, andreporting district where grown, with comparisons ............................................................................. 8Weighted average degrees Brix for all grapes crushed by California processors from the<strong>2010</strong> crop by type, variety, and reporting district where grown, with comparisons .......................... 12Tons of grapes purchased for wine, concentrate, juice, vinegar, and beverage brandy, byCalifornia processors from the <strong>2010</strong> crop by type, variety, and reporting district wheregrown, with comparisons .................................................................................................................. 14Weighted average degrees Brix for all grapes purchased for wine, concentrate, juice,vinegar, and beverage brandy, by California processors from the <strong>2010</strong> crop by type,variety, and reporting district where grown, with comparisons ......................................................... 18Weighted average grower returns per ton, delivered basis, purchased for wine,concentrate, juice, vinegar, and beverage brandy, by California processors from the <strong>2010</strong>crop by type, variety, and reporting district where grown, with comparisons ................................... 20TABLE 7: Tons of grapes purchased by California processors as distilling material other thanbeverage brandy from the <strong>2010</strong> crop by type and variety, with comparisons .................................. 24TABLE 8:Base price paid to growers for grapes crushed, delivered to California processors, from the<strong>2010</strong> crop, with Brix factors and purchased tonnage, by type, variety, reporting districtwhere grown, and weighted average base price .............................................................................. 25Supplement - <strong>2010</strong> Brix Adjustment Factor .................................................................................... 123TABLE 9:Tons of grapes crushed to growers' accounts by California processors from the <strong>2010</strong> cropby type, variety, and reporting district where grown, with comparisons. ........................................ 126TABLE 10: Weighted average grower returns per ton, delivered basis, non-related purchase for wine,concentrate, juice, vinegar, and beverage brandy, by California processors from the <strong>2010</strong>crop by type, variety, and reporting district where grown, with comparisons ................................. 128COMPILED AND PUBLISHED BY:California Department of Food and Agriculturein cooperation withUSDA’s National Agricultural Statistics Service, California Field Office650 Capitol Mall, Suite 6-100P.O. Box 942871Sacramento, CA 94271-0001Phone: (916) 498-5161 --- Fax: (916) 498-5186E-mail: nass-ca@nass.usda.gov --- Web: www.nass.usda.gov/caMARCH 10, 2011