2010 Final Grape Crush Report.pdf - GENCO
2010 Final Grape Crush Report.pdf - GENCO
2010 Final Grape Crush Report.pdf - GENCO

You also want an ePaper? Increase the reach of your titles
YUMPU automatically turns print PDFs into web optimized ePapers that Google loves.
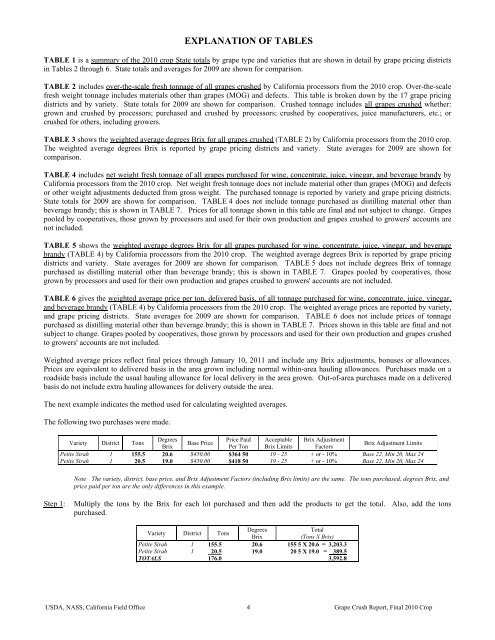
EXPLANATION OF TABLESTABLE 1 is a summary of the <strong>2010</strong> crop State totals by grape type and varieties that are shown in detail by grape pricing districtsin Tables 2 through 6. State totals and averages for 2009 are shown for comparison.TABLE 2 includes over-the-scale fresh tonnage of all grapes crushed by California processors from the <strong>2010</strong> crop. Over-the-scalefresh weight tonnage includes materials other than grapes (MOG) and defects. This table is broken down by the 17 grape pricingdistricts and by variety. State totals for 2009 are shown for comparison. <strong>Crush</strong>ed tonnage includes all grapes crushed whether:grown and crushed by processors; purchased and crushed by processors; crushed by cooperatives, juice manufacturers, etc.; orcrushed for others, including growers.TABLE 3 shows the weighted average degrees Brix for all grapes crushed (TABLE 2) by California processors from the <strong>2010</strong> crop.The weighted average degrees Brix is reported by grape pricing districts and variety. State averages for 2009 are shown forcomparison.TABLE 4 includes net weight fresh tonnage of all grapes purchased for wine, concentrate, juice, vinegar, and beverage brandy byCalifornia processors from the <strong>2010</strong> crop. Net weight fresh tonnage does not include material other than grapes (MOG) and defectsor other weight adjustments deducted from gross weight. The purchased tonnage is reported by variety and grape pricing districts.State totals for 2009 are shown for comparison. TABLE 4 does not include tonnage purchased as distilling material other thanbeverage brandy; this is shown in TABLE 7. Prices for all tonnage shown in this table are final and not subject to change. <strong>Grape</strong>spooled by cooperatives, those grown by processors and used for their own production and grapes crushed to growers' accounts arenot included.TABLE 5 shows the weighted average degrees Brix for all grapes purchased for wine, concentrate, juice, vinegar, and beveragebrandy (TABLE 4) by California processors from the <strong>2010</strong> crop. The weighted average degrees Brix is reported by grape pricingdistricts and variety. State averages for 2009 are shown for comparison. TABLE 5 does not include degrees Brix of tonnagepurchased as distilling material other than beverage brandy; this is shown in TABLE 7. <strong>Grape</strong>s pooled by cooperatives, thosegrown by processors and used for their own production and grapes crushed to growers' accounts are not included.TABLE 6 gives the weighted average price per ton, delivered basis, of all tonnage purchased for wine, concentrate, juice, vinegar,and beverage brandy (TABLE 4) by California processors from the <strong>2010</strong> crop. The weighted average prices are reported by variety,and grape pricing districts. State averages for 2009 are shown for comparison. TABLE 6 does not include prices of tonnagepurchased as distilling material other than beverage brandy; this is shown in TABLE 7. Prices shown in this table are final and notsubject to change. <strong>Grape</strong>s pooled by cooperatives, those grown by processors and used for their own production and grapes crushedto growers' accounts are not included.Weighted average prices reflect final prices through January 10, 2011 and include any Brix adjustments, bonuses or allowances.Prices are equivalent to delivered basis in the area grown including normal within-area hauling allowances. Purchases made on aroadside basis include the usual hauling allowance for local delivery in the area grown. Out-of-area purchases made on a deliveredbasis do not include extra hauling allowances for delivery outside the area.The next example indicates the method used for calculating weighted averages.The following two purchases were made.Variety District TonsDegreesPrice Paid Acceptable Brix AdjustmentBase PriceBrixPer Ton Brix Limits FactorsBrix Adjustment LimitsPetite Sirah 1 155.5 20.6 $450.00 $364 50 19 - 25 + or - 10% Base 22, Min 20, Max 24Petite Sirah 1 20.5 19.0 $450.00 $418 50 19 - 25 + or - 10% Base 22, Min 20, Max 24Note The variety, district, base price, and Brix Adjustment Factors (including Brix limits) are the same. The tons purchased, degrees Brix, andprice paid per ton are the only differences in this example.Step 1: Multiply the tons by the Brix for each lot purchased and then add the products to get the total. Also, add the tonspurchased.DegreesTotalVariety District TonsBrix(Tons X Brix)Petite Sirah 1 155.5 20.6 155 5 X 20.6 = 3,203.3Petite Sirah 1 20.5 19.0 20 5 X 19.0 = 389.5TOTALS 176.0 3,592.8USDA, NASS, California Field Office 4 <strong>Grape</strong> <strong>Crush</strong> <strong>Report</strong>, <strong>Final</strong> <strong>2010</strong> Crop