2010 Final Grape Crush Report.pdf - GENCO
2010 Final Grape Crush Report.pdf - GENCO
2010 Final Grape Crush Report.pdf - GENCO

You also want an ePaper? Increase the reach of your titles
YUMPU automatically turns print PDFs into web optimized ePapers that Google loves.
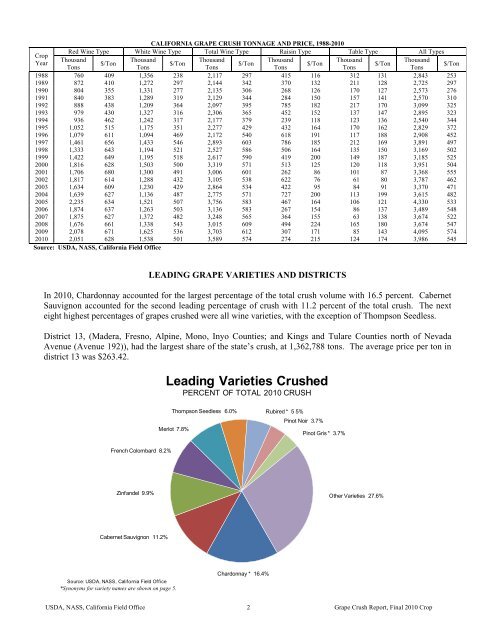
CALIFORNIA GRAPE CRUSH TONNAGE AND PRICE, 1988-<strong>2010</strong>Red Wine Type White Wine Type Total Wine Type Raisin Type Table Type All TypesCropThousandThousandThousandThousandThousandThousandYear$/Ton$/Ton$/Ton$/Ton$/Ton$/TonTonsTonsTonsTonsTonsTons1988 760 409 1,356 238 2,117 297 415 116 312 131 2,843 2531989 872 410 1,272 297 2,144 342 370 132 211 128 2,725 2971990 804 355 1,331 277 2,135 306 268 126 170 127 2,573 2761991 840 383 1,289 319 2,129 344 284 150 157 141 2,570 3101992 888 438 1,209 364 2,097 395 785 182 217 170 3,099 3251993 979 430 1,327 316 2,306 365 452 152 137 147 2,895 3231994 936 462 1,242 317 2,177 379 239 118 123 136 2,540 3441995 1,052 515 1,175 351 2,277 429 432 164 170 162 2,829 3721996 1,079 611 1,094 469 2,172 540 618 191 117 188 2,908 4521997 1,461 656 1,433 546 2,893 603 786 185 212 169 3,891 4971998 1,333 643 1,194 521 2,527 586 506 164 135 150 3,169 5021999 1,422 649 1,195 518 2,617 590 419 200 149 187 3,185 5252000 1,816 628 1,503 500 3,319 571 513 125 120 118 3,951 5042001 1,706 680 1,300 491 3,006 601 262 86 101 87 3,368 5552002 1,817 614 1,288 432 3,105 538 622 76 61 80 3,787 4622003 1,634 609 1,230 429 2,864 534 422 95 84 91 3,370 4712004 1,639 627 1,136 487 2,775 571 727 200 113 199 3,615 4822005 2,235 634 1,521 507 3,756 583 467 164 106 121 4,330 5332006 1,874 637 1,263 503 3,136 583 267 154 86 137 3,489 5482007 1,875 627 1,372 482 3,248 565 364 155 63 138 3,674 5222008 1,676 661 1,338 543 3,015 609 494 224 165 180 3,674 5472009 2,078 671 1,625 536 3,703 612 307 171 85 143 4,095 574<strong>2010</strong> 2,051 628 1,538 501 3,589 574 274 215 124 174 3,986 545Source: USDA, NASS, California Field OfficeLEADING GRAPE VARIETIES AND DISTRICTSIn <strong>2010</strong>, Chardonnay accounted for the largest percentage of the total crush volume with 16.5 percent. CabernetSauvignon accounted for the second leading percentage of crush with 11.2 percent of the total crush. The nexteight highest percentages of grapes crushed were all wine varieties, with the exception of Thompson Seedless.District 13, (Madera, Fresno, Alpine, Mono, Inyo Counties; and Kings and Tulare Counties north of NevadaAvenue (Avenue 192)), had the largest share of the state’s crush, at 1,362,788 tons. The average price per ton indistrict 13 was $263.42.Leading Varieties <strong>Crush</strong>edPERCENT OF TOTAL <strong>2010</strong> CRUSHThompson Seedless 6.0% Rubired * 5 5%Pinot Noir 3.7%Merlot 7.8%Pinot Gris * 3.7%French Colombard 8.2%Zinfandel 9.9%Other Varieties 27.6%Cabernet Sauvignon 11.2%Source: USDA, NASS, California Field Office*Synonyms for variety names are shown on page 5.Chardonnay * 16.4%USDA, NASS, California Field Office 2 <strong>Grape</strong> <strong>Crush</strong> <strong>Report</strong>, <strong>Final</strong> <strong>2010</strong> Crop