2010 Final Grape Crush Report.pdf - GENCO
2010 Final Grape Crush Report.pdf - GENCO
2010 Final Grape Crush Report.pdf - GENCO
Create successful ePaper yourself
Turn your PDF publications into a flip-book with our unique Google optimized e-Paper software.
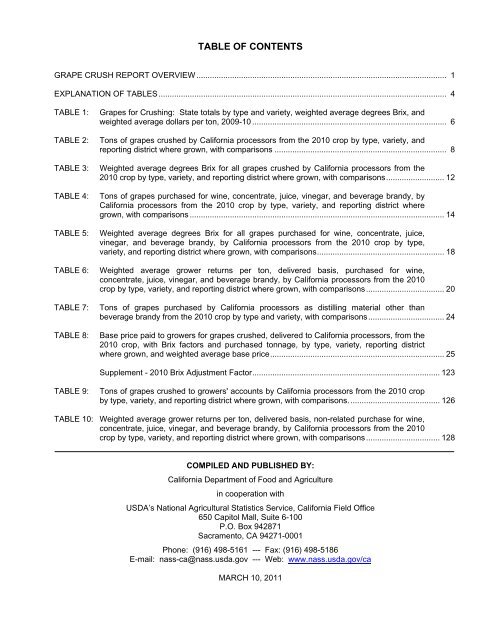
TABLE OF CONTENTSGRAPE CRUSH REPORT OVERVIEW ................................................................................................................ 1EXPLANATION OF TABLES ................................................................................................................................. 4TABLE 1:TABLE 2:TABLE 3:TABLE 4:TABLE 5:TABLE 6:<strong>Grape</strong>s for <strong>Crush</strong>ing: State totals by type and variety, weighted average degrees Brix, andweighted average dollars per ton, 2009-10 ....................................................................................... 6Tons of grapes crushed by California processors from the <strong>2010</strong> crop by type, variety, andreporting district where grown, with comparisons ............................................................................. 8Weighted average degrees Brix for all grapes crushed by California processors from the<strong>2010</strong> crop by type, variety, and reporting district where grown, with comparisons .......................... 12Tons of grapes purchased for wine, concentrate, juice, vinegar, and beverage brandy, byCalifornia processors from the <strong>2010</strong> crop by type, variety, and reporting district wheregrown, with comparisons .................................................................................................................. 14Weighted average degrees Brix for all grapes purchased for wine, concentrate, juice,vinegar, and beverage brandy, by California processors from the <strong>2010</strong> crop by type,variety, and reporting district where grown, with comparisons ......................................................... 18Weighted average grower returns per ton, delivered basis, purchased for wine,concentrate, juice, vinegar, and beverage brandy, by California processors from the <strong>2010</strong>crop by type, variety, and reporting district where grown, with comparisons ................................... 20TABLE 7: Tons of grapes purchased by California processors as distilling material other thanbeverage brandy from the <strong>2010</strong> crop by type and variety, with comparisons .................................. 24TABLE 8:Base price paid to growers for grapes crushed, delivered to California processors, from the<strong>2010</strong> crop, with Brix factors and purchased tonnage, by type, variety, reporting districtwhere grown, and weighted average base price .............................................................................. 25Supplement - <strong>2010</strong> Brix Adjustment Factor .................................................................................... 123TABLE 9:Tons of grapes crushed to growers' accounts by California processors from the <strong>2010</strong> cropby type, variety, and reporting district where grown, with comparisons. ........................................ 126TABLE 10: Weighted average grower returns per ton, delivered basis, non-related purchase for wine,concentrate, juice, vinegar, and beverage brandy, by California processors from the <strong>2010</strong>crop by type, variety, and reporting district where grown, with comparisons ................................. 128COMPILED AND PUBLISHED BY:California Department of Food and Agriculturein cooperation withUSDA’s National Agricultural Statistics Service, California Field Office650 Capitol Mall, Suite 6-100P.O. Box 942871Sacramento, CA 94271-0001Phone: (916) 498-5161 --- Fax: (916) 498-5186E-mail: nass-ca@nass.usda.gov --- Web: www.nass.usda.gov/caMARCH 10, 2011


