IDL Wavelet Toolkit User's Guide
IDL Wavelet Toolkit User's Guide
IDL Wavelet Toolkit User's Guide
Create successful ePaper yourself
Turn your PDF publications into a flip-book with our unique Google optimized e-Paper software.
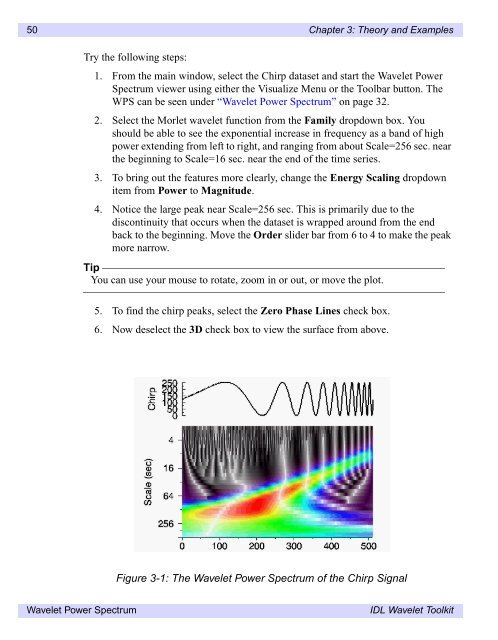
50 Chapter 3: Theory and ExamplesTry the following steps:1. From the main window, select the Chirp dataset and start the <strong>Wavelet</strong> PowerSpectrum viewer using either the Visualize Menu or the Toolbar button. TheWPS can be seen under “<strong>Wavelet</strong> Power Spectrum” on page 32.2. Select the Morlet wavelet function from the Family dropdown box. Youshould be able to see the exponential increase in frequency as a band of highpower extending from left to right, and ranging from about Scale=256 sec. nearthe beginning to Scale=16 sec. near the end of the time series.3. To bring out the features more clearly, change the Energy Scaling dropdownitem from Power to Magnitude.4. Notice the large peak near Scale=256 sec. This is primarily due to thediscontinuity that occurs when the dataset is wrapped around from the endback to the beginning. Move the Order slider bar from 6 to 4 to make the peakmore narrow.TipYou can use your mouse to rotate, zoom in or out, or move the plot.5. To find the chirp peaks, select the Zero Phase Lines check box.6. Now deselect the 3D check box to view the surface from above.Figure 3-1: The <strong>Wavelet</strong> Power Spectrum of the Chirp Signal<strong>Wavelet</strong> Power Spectrum<strong>IDL</strong> <strong>Wavelet</strong> <strong>Toolkit</strong>


