Annual report 20108.31 MB - Boskalis
Annual report 20108.31 MB - Boskalis
Annual report 20108.31 MB - Boskalis
- No tags were found...

Create successful ePaper yourself
Turn your PDF publications into a flip-book with our unique Google optimized e-Paper software.
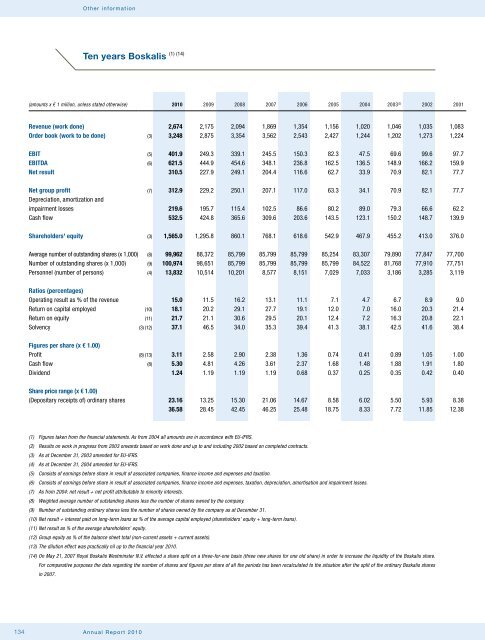
Other Financial information statements 2010Ten years <strong>Boskalis</strong>(1) (14)(amounts x € 1 million, unless stated otherwise) 2010 2009 2008 2007 2006 2005 2004 2003 (2) 2002 2001Revenue (work done) 2,674 2,175 2,094 1,869 1,354 1,156 1,020 1,046 1,035 1,083Order book (work to be done) (3) 3,248 2,875 3,354 3,562 2,543 2,427 1,244 1,202 1,273 1,224EBIT (5) 401.9 249.3 339.1 245.5 150.3 82.3 47.5 69.6 99.6 97.7EBITDA (6) 621.5 444.9 454.6 348.1 236.8 162.5 136.5 148.9 166.2 159.9Net result 310.5 227.9 249.1 204.4 116.6 62.7 33.9 70.9 82.1 77.7Net group profit (7) 312.9 229.2 250.1 207.1 117.0 63.3 34.1 70.9 82.1 77.7Depreciation, amortization andimpairment losses 219.6 195.7 115.4 102.5 86.6 80.2 89.0 79.3 66.6 62.2Cash flow 532.5 424.8 365.6 309.6 203.6 143.5 123.1 150.2 148.7 139.9Shareholders' equity (3) 1,565.0 1,295.8 860.1 768.1 618.6 542.9 467.9 455.2 413.0 376.0Average number of outstanding shares (x 1,000) (8) 99,962 88,372 85,799 85,799 85,799 85,254 83,307 79,890 77,847 77,700Number of outstanding shares (x 1,000) (9) 100,974 98,651 85,799 85,799 85,799 85,799 84,522 81,768 77,910 77,751Personnel (number of persons) (4) 13,832 10,514 10,201 8,577 8,151 7,029 7,033 3,186 3,285 3,119Ratios (percentages)Operating result as % of the revenue 15.0 11.5 16.2 13.1 11.1 7.1 4.7 6.7 8.9 9.0Return on capital employed (10) 18.1 20.2 29.1 27.7 19.1 12.0 7.0 16.0 20.3 21.4Return on equity (11) 21.7 21.1 30.6 29.5 20.1 12.4 7.2 16.3 20.8 22.1Solvency (3) (12) 37.1 46.5 34.0 35.3 39.4 41.3 38.1 42.5 41.6 38.4Figures per share (x € 1.00)Profit (8) (13) 3.11 2.58 2.90 2.38 1.36 0.74 0.41 0.89 1.05 1.00Cash flow (8) 5.30 4.81 4.26 3.61 2.37 1.68 1.48 1.88 1.91 1.80Dividend 1.24 1.19 1.19 1.19 0.68 0.37 0.25 0.35 0.42 0.40Share price range (x € 1.00)(Depositary receipts of) ordinary shares 23.16 13.25 15.30 21.06 14.67 8.58 6.02 5.50 5.93 8.3836.58 28.45 42.45 46.25 25.48 18.75 8.33 7.72 11.85 12.38(1) Figures taken from the financial statements. As from 2004 all amounts are in accordance with EU-IFRS.(2) Results on work in progress from 2003 onwards based on work done and up to and including 2002 based on completed contracts.(3) As at December 31, 2003 amended for EU-IFRS.(4) As at December 31, 2004 amended for EU-IFRS.(5) Consists of earnings before share in result of associated companies, finance income and expenses and taxation.(6) Consists of earnings before share in result of associated companies, finance income and expenses, taxation, depreciation, amortisation and impairment losses.(7) As from 2004: net result + net profit attributable to minority interests.(8) Weighted average number of outstanding shares less the number of shares owned by the company.(9) Number of outstanding ordinary shares less the number of shares owned by the company as at December 31.(10) Net result + interest paid on long-term loans as % of the average capital employed (shareholders’ equity + long-term loans).(11) Net result as % of the average shareholders’ equity.(12) Group equity as % of the balance sheet total (non-current assets + current assets).(13) The dilution effect was practically nil up to the financial year 2010.(14) On May 21, 2007 Royal <strong>Boskalis</strong> Westminster N.V. effected a share split on a three-for-one basis (three new shares for one old share) in order to increase the liquidity of the <strong>Boskalis</strong> share.For comparative purposes the data regarding the number of shares and figures per share of all the periods has been recalculated to the situation after the split of the ordinary <strong>Boskalis</strong> sharesin 2007.134 132<strong>Annual</strong> Report 2010