Annual report 20108.31 MB - Boskalis
Annual report 20108.31 MB - Boskalis
Annual report 20108.31 MB - Boskalis
- No tags were found...

You also want an ePaper? Increase the reach of your titles
YUMPU automatically turns print PDFs into web optimized ePapers that Google loves.
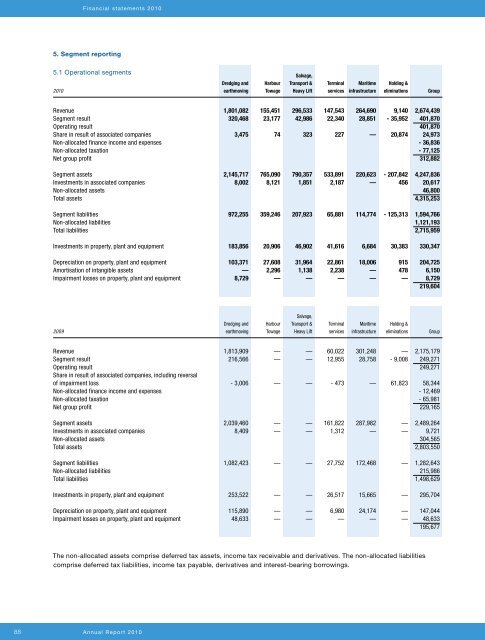
Financial statements 20105. Segment <strong>report</strong>ing5.1 Operational segments2010Dredging andearthmovingHarbourTowageSalvage,Transport &Heavy LiftTerminalservicesMaritimeinfrastructureHolding &eliminationsGroupRevenue 1,801,082 155,451 296,533 147,543 264,690 9,140 2,674,439Segment result 320,468 23,177 42,986 22,340 28,851 - 35,952 401,870Operating result 401,870Share in result of associated companies 3,475 74 323 227 — 20,874 24,973Non-allocated finance income and expenses - 36,836Non-allocated taxation - 77,125Net group profit 312,882Segment assets 2,145,717 765,090 790,357 533,891 220,623 - 207,842 4,247,836Investments in associated companies 8,002 8,121 1,851 2,187 — 456 20,617Non-allocated assets 46,800Total assets 4,315,253Segment liabilities 972,255 359,246 207,923 65,881 114,774 - 125,313 1,594,766Non-allocated liabilities 1,121,193Total liabilities 2,715,959Investments in property, plant and equipment 183,856 20,906 46,902 41,616 6,684 30,383 330,347Depreciation on property, plant and equipment 103,371 27,608 31,964 22,861 18,006 915 204,725Amortisation of intangible assets — 2,296 1,138 2,238 — 478 6,150Impairment losses on property, plant and equipment 8,729 — — — — — 8,729219,6042009Dredging andearthmovingHarbourTowageSalvage,Transport &Heavy LiftTerminalservicesMaritimeinfrastructureHolding &eliminationsGroupRevenue 1,813,909 — — 60,022 301,248 — 2,175,179Segment result 216,566 — — 12,955 28,758 - 9,008 249,271Operating result 249,271Share in result of associated companies, including reversalof impairment loss - 3,006 — — - 473 — 61,823 58,344Non-allocated finance income and expenses - 12,469Non-allocated taxation - 65,981Net group profit 229,165Segment assets 2,039,460 — — 161,822 287,982 — 2,489,264Investments in associated companies 8,409 — — 1,312 — — 9,721Non-allocated assets 304,565Total assets 2,803,550Segment liabilities 1,082,423 — — 27,752 172,468 — 1,282,643Non-allocated liabilities 215,986Total liabilities 1,498,629Investments in property, plant and equipment 253,522 — — 26,517 15,665 — 295,704Depreciation on property, plant and equipment 115,890 — — 6,980 24,174 — 147,044Impairment losses on property, plant and equipment 48,633 — — — — — 48,633195,677The non-allocated assets comprise deferred tax assets, income tax receivable and derivatives. The non-allocated liabilitiescomprise deferred tax liabilities, income tax payable, derivatives and interest-bearing borrowings.88 <strong>Annual</strong> Report 2010