- Page 1: AnnualRePORT2010
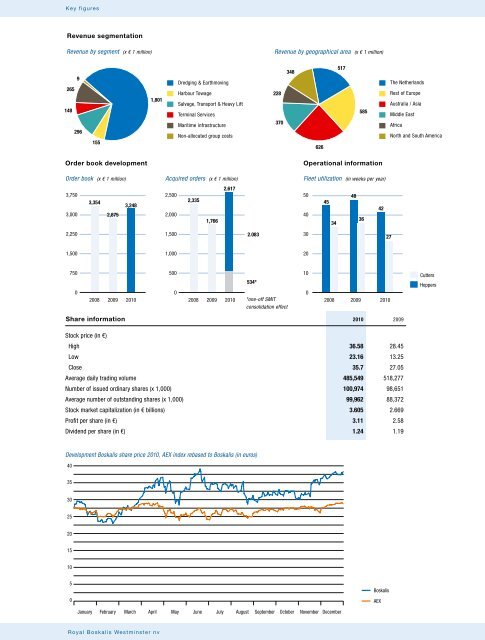
- Page 5 and 6: Summary financial information 2010A
- Page 8 and 9: Summary financial information 2010C
- Page 10 and 11: Chairman’s statementA major initi
- Page 12: 8Maasvlakte 2 project, the Netherla
- Page 15 and 16: Boskalis at a glanceCompany profile
- Page 17 and 18: Boskalis at a glanceActivitiesDredg
- Page 19 and 20: StrategyContainer throughput* (mill
- Page 21 and 22: StrategyIn the next few years we wi
- Page 24 and 25: Summary financial information 20102
- Page 26 and 27: Boskalis at a glanceShareholder inf
- Page 28: 24Cutter suction dredgersCutter suc
- Page 31 and 32: Report of the Supervisory Boardinve
- Page 33 and 34: Report of the Supervisory Boardexte
- Page 35 and 36: Summary Report of financial the Sup
- Page 38 and 39: Summary financial information 20103
- Page 40 and 41: Summary Report of financial the Boa
- Page 42 and 43: Report of the Board of ManagementHi
- Page 44 and 45: Report of the Board of ManagementRe
- Page 46 and 47: Report of the Board of ManagementRe
- Page 48 and 49: Report of the Board of Managementex
- Page 50 and 51: Report of the Board of ManagementOp
- Page 52 and 53:
Operational performance• Echoscop
- Page 54 and 55:
Report of the Board of ManagementCo
- Page 56 and 57:
Report of the Board of ManagementOp
- Page 58 and 59:
Report of the Board of Managementpo
- Page 60 and 61:
Risk managementRisks with regard to
- Page 62 and 63:
Report of the Board of ManagementCo
- Page 64 and 65:
Report of the Board of ManagementOu
- Page 66:
62Trailing suction hopper dredgersT
- Page 69 and 70:
Financial statements 2010Financial
- Page 71 and 72:
Financial statements 201013. Intang
- Page 73 and 74:
Financial statements 2010Consolidat
- Page 75 and 76:
Financial statements 2010Consolidat
- Page 77 and 78:
Financial statements 2010(in € 1,
- Page 79 and 80:
Financial statements 2010the identi
- Page 81 and 82:
Financial statements 2010translatio
- Page 83 and 84:
Financial statements 2010of assets.
- Page 85 and 86:
Financial statements 2010to an amou
- Page 87 and 88:
Financial statements 2010The intere
- Page 89 and 90:
Financial statements 2010The operat
- Page 91 and 92:
Financial statements 2010Review in
- Page 93 and 94:
Financial statements 2010The revenu
- Page 95 and 96:
Financial statements 201011. Income
- Page 97 and 98:
Financial statements 201013. Intang
- Page 99 and 100:
Financial statements 2010Land andbu
- Page 101 and 102:
Financial statements 201018. Due fr
- Page 103 and 104:
Financial statements 201021.4 Earni
- Page 105 and 106:
Financial statements 2010To finance
- Page 107 and 108:
Financial statements 2010Some of th
- Page 109 and 110:
Financial statements 2010The provis
- Page 111 and 112:
Financial statements 20102010 2009B
- Page 113 and 114:
Financial statements 2010Currency t
- Page 115 and 116:
Financial statements 201026.2 On-ba
- Page 117 and 118:
Financial statements 2010The result
- Page 119 and 120:
Financial statements 201028. Subseq
- Page 121 and 122:
Financial statements 2010Ownership
- Page 123 and 124:
Financial statements 2010Joint vent
- Page 125 and 126:
Financial statements 2010Transactio
- Page 127 and 128:
Financial statements 2010Company in
- Page 129 and 130:
Financial statements 2010Statement
- Page 131 and 132:
Financial statements 20103. Investm
- Page 133 and 134:
Financial statements 20109. Auditor
- Page 135 and 136:
Financial statements 2010Independen
- Page 137 and 138:
Other informationTen-year overview
- Page 139 and 140:
Other informationStichting Continu
- Page 141 and 142:
Supervision, Board & ManagementMemb
- Page 143 and 144:
Supervision, Board & ManagementDred
- Page 145 and 146:
Other informationDisclosures requir
- Page 147 and 148:
Other informationGlossaryAcquired o
- Page 149 and 150:
ColophonCompiled and coordinated by