WHOI-90-52
WHOI-90-52
WHOI-90-52

Create successful ePaper yourself
Turn your PDF publications into a flip-book with our unique Google optimized e-Paper software.
Europen Programs in Marne Science al Technology<br />
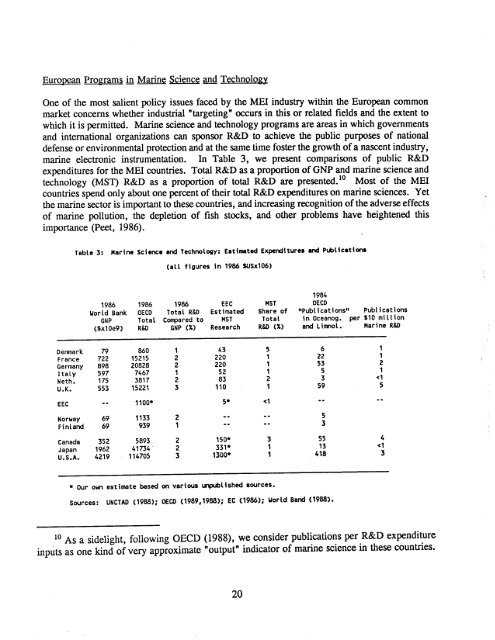
One of the most saient policy issues face by the MEI industr within the Europe common<br />
market concerns whether industral "tageting" ocurs in this or relate fields and the extent to<br />
which it is permitted. Marne science and tehnology programs are areas in which governments<br />
and international organizations ca sponsor R&D to achieve the public purpses of national<br />
defense or environmenta protection and at the sae time foster the growth of a nascent industr ,<br />
marne electronic instrmentation. In Table 3, we present comparsons of public R&D<br />
expenditures for the MEI countres. Tota R&D as a proporton of GNP and marne science and<br />
10 Most of the MEI<br />
technology (MST) R&D as a proporton of tota R&D are presente.<br />
countres spend only about one percent of their tota R&D expenditures on marne sciences. Yet<br />
the marne sector is importt to these countres, and increaing recognition of the adverse effects<br />
of marne pollution, the depletion of fish stocks, and other problems have heightened this<br />
importce (Peet, 1986).<br />
Table 3: Marine Sciene and Technology: Estimated Expenditures .nd Publtc.tlon<br />
1986<br />
World Bank<br />
GNP<br />
($x10e9)<br />
(all figures In 1986 SUSx106)<br />
1986 1986<br />
OECD Total R&D<br />
Total Comared to<br />
R&D GNP (X)<br />
Denmark 79 860 1<br />
France 722 1<strong>52</strong>15 2<br />
Germany 898 20828 2<br />
Italy 597 7467 1<br />
Neth. 175 3817 2<br />
U.K. 553 1<strong>52</strong>21 3<br />
EEC<br />
1 100*<br />
Norway 69 1133 2<br />
Finland 69 939 1<br />
Canada 3<strong>52</strong> 5893 2<br />
Japan 1962 41734 . 2<br />
U.S.A. 4219 114705 3<br />
EEC<br />
Estimated<br />
HST<br />
Research<br />
43<br />
220<br />
220<br />
<strong>52</strong><br />
83<br />
110<br />
150*<br />
331*<br />
1300*<br />
HST<br />
Share of<br />
Total<br />
R&o (X)<br />
5<br />
, 1<br />
1<br />
2<br />
5* 0(1<br />
* Our own estimate based on various i.ltshed sources.<br />
1<br />
3<br />
1<br />
1<br />
1984<br />
OECD<br />
"Publ i cat ions" Publ i cat ions<br />
in Oceanog. per $10 million<br />
and Limnol. Harine R&o<br />
6<br />
22<br />
53<br />
5<br />
3<br />
59<br />
5<br />
3<br />
55<br />
13<br />
418<br />
Sources: UNCTAD (1988); oeco (1989,1988); EC (1986); World Band (1988).<br />
10 As a sidelight, following OECD (1988), we consider publications per R&D expenditure<br />
inpùts as one kind of very approximate "output" indicator of marne science in these countres.<br />
20<br />
1<br />
1<br />
2<br />
1<br />
0(1<br />
5<br />
4<br />
0(1<br />
3