Master Thesis - Fachbereich Informatik
Master Thesis - Fachbereich Informatik
Master Thesis - Fachbereich Informatik

Create successful ePaper yourself
Turn your PDF publications into a flip-book with our unique Google optimized e-Paper software.
5.3. EXPERIMENTAL RESULTS 113<br />
GTD [mm]<br />
0.7<br />
0.6<br />
0.5<br />
0.4<br />
0.3<br />
0.2<br />
0.1<br />
0<br />
-0.1<br />
-0.2<br />
-0.3<br />
-0.4<br />
-0.5<br />
-0.6<br />
ground truth distance<br />
-0.7<br />
0 5 10 15 20 25 30 35 40 45 50 55 60 65 70 75 80 85 90 95 100 105<br />
Tube number<br />
(a)<br />
1<br />
0.8<br />
0.6<br />
0.4<br />
0.2<br />
0<br />
Measurement distribution<br />
Ground truth distribution<br />
49 49.2 49.4 49.6 49.8 50 50.2 50.4 50.6 50.8 51<br />
Length [mm]<br />
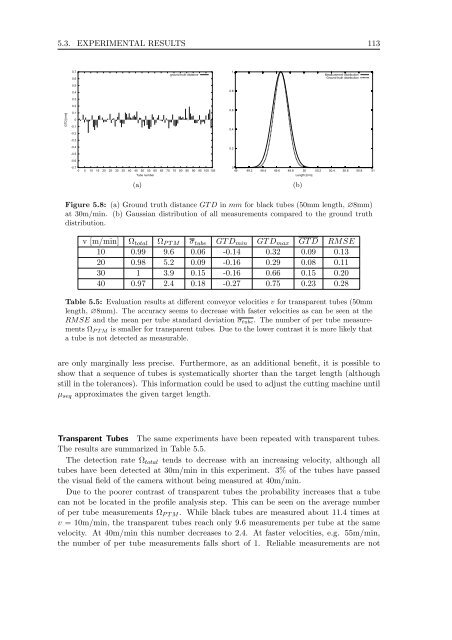
Figure 5.8: (a) Ground truth distance GT D in mm for black tubes (50mm length, ∅8mm)<br />
at 30m/min. (b) Gaussian distribution of all measurements compared to the ground truth<br />
distribution.<br />
v[m/min] Ωtotal ΩPTM σtube GT Dmin GT Dmax GT D RMSE<br />
10 0.99 9.6 0.06 -0.14 0.32 0.09 0.13<br />
20 0.98 5.2 0.09 -0.16 0.29 0.08 0.11<br />
30 1 3.9 0.15 -0.16 0.66 0.15 0.20<br />
40 0.97 2.4 0.18 -0.27 0.75 0.23 0.28<br />
Table 5.5: Evaluation results at different conveyor velocities v for transparent tubes (50mm<br />
length, ∅8mm). The accuracy seems to decrease with faster velocities as can be seen at the<br />
RMSE and the mean per tube standard deviation σtube. The number of per tube measurements<br />
ΩPTM is smaller for transparent tubes. Due to the lower contrast it is more likely that<br />
a tube is not detected as measurable.<br />
are only marginally less precise. Furthermore, as an additional benefit, it is possible to<br />
show that a sequence of tubes is systematically shorter than the target length (although<br />
still in the tolerances). This information could be used to adjust the cutting machine until<br />
µseq approximates the given target length.<br />
Transparent Tubes The same experiments have been repeated with transparent tubes.<br />
The results are summarized in Table 5.5.<br />
The detection rate Ωtotal tends to decrease with an increasing velocity, although all<br />
tubes have been detected at 30m/min in this experiment. 3% of the tubes have passed<br />
the visual field of the camera without being measured at 40m/min.<br />
Due to the poorer contrast of transparent tubes the probability increases that a tube<br />
can not be located in the profile analysis step. This can be seen on the average number<br />
of per tube measurements ΩPTM. While black tubes are measured about 11.4 timesat<br />
v = 10m/min, the transparent tubes reach only 9.6 measurements per tube at the same<br />
velocity. At 40m/min this number decreases to 2.4. At faster velocities, e.g. 55m/min,<br />
the number of per tube measurements falls short of 1. Reliable measurements are not<br />
(b)