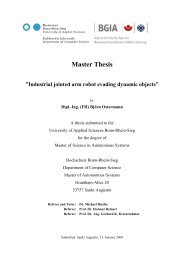
Master Thesis - Fachbereich Informatik
Master Thesis - Fachbereich Informatik
Master Thesis - Fachbereich Informatik

You also want an ePaper? Increase the reach of your titles
YUMPU automatically turns print PDFs into web optimized ePapers that Google loves.
114 CHAPTER 5. RESULTS AND EVALUATION<br />
GTD [mm]<br />
0.7<br />
0.6<br />
0.5<br />
0.4<br />
0.3<br />
0.2<br />
0.1<br />
0<br />
-0.1<br />
-0.2<br />
-0.3<br />
-0.4<br />
-0.5<br />
-0.6<br />
ground truth distance<br />
tube marker<br />
-0.7<br />
0 5 10 15 20 25 30 35 40 45 50 55 60 65 70 75 80 85 90 95 100<br />
Tube number<br />
(a)<br />
1<br />
0.8<br />
0.6<br />
0.4<br />
0.2<br />
0<br />
Measurement distribution<br />
Ground truth distribution<br />
49 49.2 49.4 49.6 49.8 50 50.2 50.4 50.6 50.8 51<br />
Length [mm]<br />
Figure 5.9: (a) Ground truth distance GT D in mm for transparent tubes (50mm length,<br />
∅8mm) at 30m/min. The measurements marked by a ‘+’ are all belonging to the same tube<br />
that reached the maximum GT D at measurement 68. As one can see it is not systematically<br />
measured wrong. A poor contrast region on the conveyor belt is rather the origin for the strong<br />
deviations from the ground truth. (b) Gaussian distribution of all measurements compared to<br />
the ground truth distribution.<br />
possible at this velocity for transparent tubes so far and are therefore not considered in<br />
Table 5.5.<br />
The standard deviation σtube of transparent tubes moved at 40m/min is three times<br />
larger than at 10m/min. This can be explained by the smaller number of per tube measurements.<br />
The ground truth distance increases also with the velocity. Especially GT D<br />
gets conspicuously larger, i.e. the measured lengths are larger than the ground truth<br />
length on average. This trend can also be observed at the absolute value of GT Dmax and<br />
GT Dmin. At a velocity of 40m/min the maximum ground truth distance is 0.75 which<br />
is more than the allowed tolerance. In this context one has to keep in mind that these<br />
values are only the extrema and do not describe the average distribution. This makes the<br />
ground truth distance measure very sensitive to outliers. However, a large GT D value<br />
does not have to mean poor accuracy automatically. On the other hand if the ground<br />
truth distance is low in the extrema as with the black tubes in this experiment, this is an<br />
additional indicator of high accuracy. The ground truth distance of the transparent tubes<br />
at 30m/min is shown in Figure 5.9(a). The deviations are significantly larger compared<br />
to Figure 5.8(a).<br />
Instead of being approximately equally distributed as for the black tubes, the error of<br />
transparent tubes seems to increase and decrease randomly, but always over a range of<br />
consecutive measurements. This observation can be explained by the varying background<br />
intensity at back light through the conveyor belt. The periodic intensity changes influence<br />
the transparent tubes obviously much stronger than the black tubes since the detection<br />
quality depends mostly on the image contrast. Figure 5.10 shows how the mean image<br />
intensity of a moving empty conveyor belt changes over time. If a tube is measured at<br />
a part on the conveyor belt that yields a poor contrast under back light, the GT D is<br />
likely to increase. Having in mind each tube passes the measuring area 6 times in this<br />
experiment, the probability is small that it is always measured at the same position on<br />
the conveyor. The tube measured with the maximum GT D hasbeenmarkedintheplot<br />
(b)