Master Thesis - Fachbereich Informatik
Master Thesis - Fachbereich Informatik
Master Thesis - Fachbereich Informatik

Create successful ePaper yourself
Turn your PDF publications into a flip-book with our unique Google optimized e-Paper software.
70 CHAPTER 4. LENGTH MEASUREMENT APPROACH<br />
400<br />
350<br />
300<br />
250<br />
200<br />
150<br />
100<br />
50<br />
!<br />
400<br />
350<br />
300<br />
250<br />
200<br />
150<br />
100<br />
50<br />
smoothed profile<br />
segment boundaries<br />
predicted tube boundaries<br />
local median<br />
global mean<br />
Background Background<br />
Tube 1 Tube 2<br />
0 20 40 60 80 100<br />
x<br />
120 140 160 180<br />
(a) Transparent/ State: entering + centered<br />
smoothed profile<br />
segment boundaries<br />
predicted tube boundaries<br />
local median<br />
global mean<br />
Background Background<br />
0<br />
Tube 1 Tube 2 Tube 3<br />
0 20 40 60 80 100<br />
x<br />
120 140 160 180<br />
(b) Black/ State: entering + centered + leaving<br />
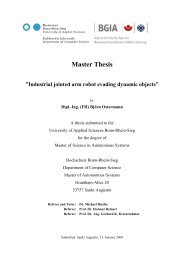
Figure 4.14: Different steps and results of the profile analysis. After smoothing the profile,<br />
strong peaks in the first derivative indicate potential tube boundaries. The segments between<br />
the strongest peaks are classified into foreground and background based on the difference<br />
between the local median of each segment and the global mean. The background is assumed<br />
to be brighter on average. Neighboring segments of the same class are merged. The crosses<br />
mark the correctly predicted boundaries of the centered tube. Note the stronger contrast of<br />
black tubes.