Master Thesis - Fachbereich Informatik
Master Thesis - Fachbereich Informatik
Master Thesis - Fachbereich Informatik

Create successful ePaper yourself
Turn your PDF publications into a flip-book with our unique Google optimized e-Paper software.
A.3. SCAN LINES 139<br />
gray value<br />
400<br />
350<br />
300<br />
250<br />
200<br />
150<br />
100<br />
50<br />
1 scanline (y=61)<br />
1 scanline (y=80)<br />
1 scanline (y=100)<br />
0<br />
0 100 200 300 400<br />
x<br />
500 600 700<br />
(b)<br />
(a)<br />
gray value<br />
400<br />
350<br />
300<br />
250<br />
200<br />
150<br />
100<br />
50<br />
normalized sum of 11 scanlines<br />
normalized sum of all rows<br />
0<br />
0 100 200 300 400<br />
x<br />
500 600 700<br />
(d) (e)<br />
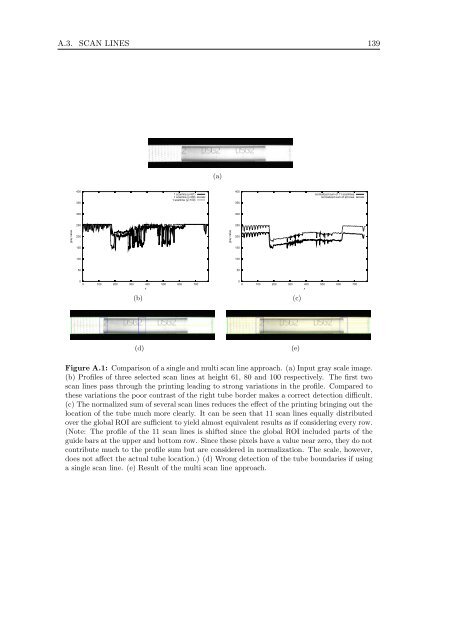
Figure A.1: Comparison of a single and multi scan line approach. (a) Input gray scale image.<br />
(b) Profiles of three selected scan lines at height 61, 80 and 100 respectively. The first two<br />
scan lines pass through the printing leading to strong variations in the profile. Compared to<br />
these variations the poor contrast of the right tube border makes a correct detection difficult.<br />
(c) The normalized sum of several scan lines reduces the effect of the printing bringing out the<br />
location of the tube much more clearly. It can be seen that 11 scan lines equally distributed<br />
over the global ROI are sufficient to yield almost equivalent results as if considering every row.<br />
(Note: The profile of the 11 scan lines is shifted since the global ROI included parts of the<br />
guide bars at the upper and bottom row. Since these pixels have a value near zero, they do not<br />
contribute much to the profile sum but are considered in normalization. The scale, however,<br />
does not affect the actual tube location.) (d) Wrong detection of the tube boundaries if using<br />
a single scan line. (e) Result of the multi scan line approach.<br />
(c)