Design, Fabrication and Characterization of a Microwave Resonator ...
Design, Fabrication and Characterization of a Microwave Resonator ...
Design, Fabrication and Characterization of a Microwave Resonator ...

You also want an ePaper? Increase the reach of your titles
YUMPU automatically turns print PDFs into web optimized ePapers that Google loves.
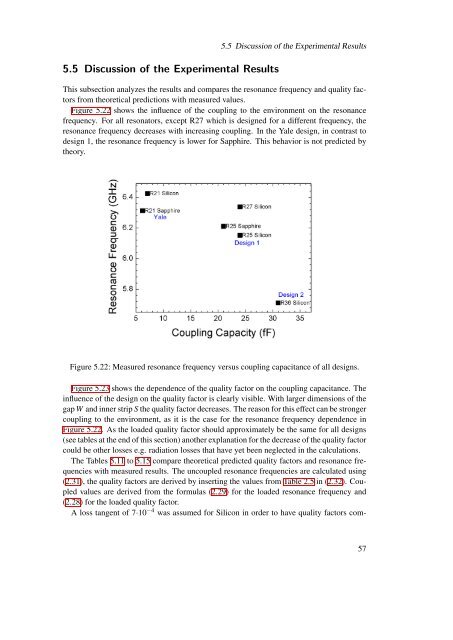
5.5 Discussion <strong>of</strong> the Experimental Results5.5 Discussion <strong>of</strong> the Experimental ResultsThis subsection analyzes the results <strong>and</strong> compares the resonance frequency <strong>and</strong> quality factorsfrom theoretical predictions with measured values.Figure 5.22 shows the influence <strong>of</strong> the coupling to the environment on the resonancefrequency. For all resonators, except R27 which is designed for a different frequency, theresonance frequency decreases with increasing coupling. In the Yale design, in contrast todesign 1, the resonance frequency is lower for Sapphire. This behavior is not predicted bytheory.Figure 5.22: Measured resonance frequency versus coupling capacitance <strong>of</strong> all designs.Figure 5.23 shows the dependence <strong>of</strong> the quality factor on the coupling capacitance. Theinfluence <strong>of</strong> the design on the quality factor is clearly visible. With larger dimensions <strong>of</strong> thegap W <strong>and</strong> inner strip S the quality factor decreases. The reason for this effect can be strongercoupling to the environment, as it is the case for the resonance frequency dependence inFigure 5.22. As the loaded quality factor should approximately be the same for all designs(see tables at the end <strong>of</strong> this section) another explanation for the decrease <strong>of</strong> the quality factorcould be other losses e.g. radiation losses that have yet been neglected in the calculations.The Tables 5.11 to 5.15 compare theoretical predicted quality factors <strong>and</strong> resonance frequencieswith measured results. The uncoupled resonance frequencies are calculated using(2.31), the quality factors are derived by inserting the values from Table 2.5 in (2.32). Coupledvalues are derived from the formulas (2.29) for the loaded resonance frequency <strong>and</strong>(2.28) for the loaded quality factor.A loss tangent <strong>of</strong> 7·10 −4 was assumed for Silicon in order to have quality factors com-57