- Page 3 and 4: УДК 338ББК 65.9Е 91Eurasian
- Page 5 and 6: ContentsContentsList of Figures and
- Page 7: List of Figures and TablesList of F
- Page 11 and 12: List of AbbreviationsList of Abbrev
- Page 13 and 14: GreetingsForewordThe Eurasian Devel
- Page 15 and 16: IntroductionThe Customs Unionand th
- Page 17 and 18: Introductionbottom up’, with mini
- Page 19 and 20: Introductionrepresent both the obje
- Page 21 and 22: Customs Unionand the Single Economi
- Page 23 and 24: Customs Unionand the Single Economi
- Page 25 and 26: Customs Unionand the Single Economi
- Page 27 and 28: Customs Unionand the Single Economi
- Page 29 and 30: Customs Unionand the Single Economi
- Page 31 and 32: Customs Unionand the Single Economi
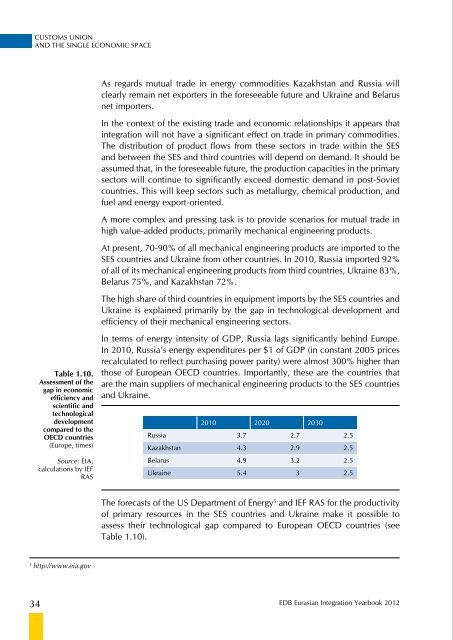
- Page 33: Customs Unionand the Single Economi
- Page 37 and 38: Customs Unionand the Single Economi
- Page 39 and 40: Customs Unionand the Single Economi
- Page 41 and 42: Customs Unionand the Single Economi
- Page 43 and 44: Customs Unionand the Single Economi
- Page 45 and 46: Customs Unionand the Single Economi
- Page 47 and 48: Customs Unionand the Single Economi
- Page 49 and 50: Customs Unionand the Single Economi
- Page 51 and 52: Customs Unionand the Single Economi
- Page 53 and 54: Customs Unionand the Single Economi
- Page 55 and 56: Customs Unionand the Single Economi
- Page 57 and 58: Customs Unionand the Single Economi
- Page 59 and 60: Customs Unionand the Single Economi
- Page 61 and 62: Customs Unionand the Single Economi
- Page 63 and 64: Customs Unionand the Single Economi
- Page 65 and 66: Customs Unionand the Single Economi
- Page 67 and 68: Customs Unionand the Single Economi
- Page 69 and 70: Customs Unionand the Single Economi
- Page 71 and 72: Customs Unionand the Single Economi
- Page 73 and 74: Customs Unionand the Single Economi
- Page 75 and 76: Customs Unionand the Single Economi
- Page 77 and 78: Customs Unionand the Single Economi
- Page 79 and 80: Customs Unionand the Single Economi
- Page 81 and 82: The Economics of the Post-Sovietand
- Page 83 and 84: The Economics of the Post-Sovietand
- Page 85 and 86:
The Economics of the Post-Sovietand
- Page 87 and 88:
The Economics of the Post-Sovietand
- Page 89 and 90:
The Economics of the Post-Sovietand
- Page 91 and 92:
The Economics of the Post-Sovietand
- Page 93 and 94:
The Economics of the Post-Sovietand
- Page 95 and 96:
The Economics of the Post-Sovietand
- Page 97 and 98:
The Economics of the Post-Sovietand
- Page 99 and 100:
The Economics of the Post-Sovietand
- Page 101 and 102:
The Economics of the Post-Sovietand
- Page 103 and 104:
The Economics of the Post-Sovietand
- Page 105 and 106:
The Economics of the Post-Sovietand
- Page 107 and 108:
The Economics of the Post-Sovietand
- Page 109 and 110:
The Economics of the Post-Sovietand
- Page 111 and 112:
The Economics of the Post-Sovietand
- Page 113 and 114:
The Economics of the Post-Sovietand
- Page 115 and 116:
The Economics of the Post-Sovietand
- Page 117 and 118:
The Economics of the Post-Sovietand
- Page 119 and 120:
The Economics of the Post-Sovietand
- Page 121 and 122:
The Economics of the Post-Sovietand
- Page 123 and 124:
The Economics of the Post-Sovietand
- Page 125 and 126:
The Economics of the Post-Sovietand
- Page 127 and 128:
The Economics of the Post-Sovietand
- Page 129 and 130:
The Economics of the Post-Sovietand
- Page 131 and 132:
The Economics of the Post-Sovietand
- Page 133 and 134:
The Economics of the Post-Sovietand
- Page 135 and 136:
The Economics of the Post-Sovietand
- Page 137 and 138:
The Economics of the Post-Sovietand
- Page 139 and 140:
The Economics of the Post-Sovietand
- Page 141 and 142:
The Economics of the Post-Sovietand
- Page 143 and 144:
The Economics of the Post-Sovietand
- Page 145 and 146:
The Economics of the Post-Sovietand
- Page 147 and 148:
The Economics of the Post-Sovietand
- Page 149 and 150:
The Economics of the Post-Sovietand
- Page 151 and 152:
The Economics of the Post-Sovietand
- Page 153 and 154:
The Economics of the Post-Sovietand
- Page 155 and 156:
The Economics of the Post-Sovietand
- Page 157 and 158:
The Economics of the Post-Sovietand
- Page 159 and 160:
The Economics of the Post-Sovietand
- Page 161 and 162:
The Economics of the Post-Sovietand
- Page 163 and 164:
The Economics of the Post-Sovietand
- Page 165 and 166:
Advanced Economic Cooperationin Sec
- Page 167 and 168:
Advanced Economic Cooperationin Sec
- Page 169 and 170:
Advanced Economic Cooperationin Sec
- Page 171 and 172:
Advanced Economic Cooperationin Sec
- Page 173 and 174:
Advanced Economic Cooperationin Sec
- Page 175 and 176:
Advanced Economic Cooperationin Sec
- Page 177 and 178:
Advanced Economic Cooperationin Sec
- Page 179 and 180:
Advanced Economic Cooperationin Sec
- Page 181 and 182:
Advanced Economic Cooperationin Sec
- Page 183 and 184:
Advanced Economic Cooperationin Sec
- Page 185 and 186:
Advanced Economic Cooperationin Sec
- Page 187 and 188:
Advanced Economic Cooperationin Sec
- Page 189 and 190:
Advanced Economic Cooperationin Sec
- Page 191 and 192:
Advanced Economic Cooperationin Sec
- Page 193 and 194:
Advanced Economic Cooperationin Sec
- Page 195 and 196:
Advanced Economic Cooperationin Sec
- Page 197 and 198:
Advanced Economic Cooperationin Sec
- Page 199 and 200:
Advanced Economic Cooperationin Sec
- Page 201 and 202:
Advanced Economic Cooperationin Sec
- Page 203 and 204:
Advanced Economic Cooperationin Sec
- Page 205 and 206:
Advanced Economic Cooperationin Sec
- Page 207 and 208:
Advanced Economic Cooperationin Sec
- Page 209 and 210:
Advanced Economic Cooperationin Sec
- Page 211 and 212:
Advanced Economic Cooperationin Sec
- Page 213 and 214:
Advanced Economic Cooperationin Sec
- Page 215 and 216:
Advanced Economic Cooperationin Sec
- Page 217 and 218:
Advanced Economic Cooperationin Sec
- Page 219 and 220:
Advanced Economic Cooperationin Sec
- Page 221 and 222:
Advanced Economic Cooperationin Sec
- Page 223 and 224:
Advanced Economic Cooperationin Sec
- Page 225 and 226:
Advanced Economic Cooperationin Sec
- Page 227 and 228:
Advanced Economic Cooperationin Sec
- Page 229 and 230:
Advanced Economic Cooperationin Sec
- Page 231 and 232:
2011: Data and Reviewsthe customs b
- Page 233 and 234:
2011: Data and ReviewsUkraine has p
- Page 235 and 236:
2011: Data and ReviewsIt was also n
- Page 237 and 238:
2011: Data and ReviewsEU are less t
- Page 239 and 240:
2011: Data and Reviewsmajority of w
- Page 241 and 242:
2011: Data and Reviewsworking group
- Page 243 and 244:
2011: Data and ReviewsBelarus accor
- Page 245 and 246:
2011: Data and Reviewsa revised ver
- Page 247 and 248:
2011: Data and ReviewsNew integrati
- Page 249 and 250:
2011: Data and ReviewsThe agreement
- Page 251 and 252:
2011: Data and Reviewsthe SCO was s
- Page 253 and 254:
2011: Data and ReviewsBelarus intro
- Page 255 and 256:
2011: Data and ReviewsRussia accede
- Page 257 and 258:
2011: Data and Reviewsopportunity t
- Page 259 and 260:
2011: Data and ReviewsWashington, B
- Page 261 and 262:
2011: Data and ReviewsECONOMIC SECT
- Page 263 and 264:
2011: Data and ReviewsBelarusian ga
- Page 265 and 266:
2011: Data and Reviewsthe first qua
- Page 267 and 268:
2011: Data and ReviewsNote:In 2010
- Page 269 and 270:
2011: Data and ReviewsUkraine annou
- Page 271 and 272:
2011: Data and ReviewsKazakhstan, R
- Page 273 and 274:
2011: Data and ReviewsTurkmenistan
- Page 275 and 276:
2011: Data and ReviewsKazatomprom h
- Page 277 and 278:
2011: Data and Reviewswould begin i
- Page 279 and 280:
2011: Data and Reviewsdifferent eng
- Page 281 and 282:
2011: Data and Reviewsgroup for $15
- Page 283 and 284:
2011: Data and ReviewsKazakhstan, R
- Page 285 and 286:
2011: Data and ReviewsRussia decide
- Page 287 and 288:
2011: Data and ReviewsGeorgy Kuznet
- Page 289 and 290:
2011: Data and ReviewsPharmstandard
- Page 291 and 292:
2011: Data and Reviewsmilitary and
- Page 293 and 294:
2011: Data and ReviewsUkraine to ch
- Page 295 and 296:
2011: Data and ReviewsUS military b
- Page 297 and 298:
2011: Data and Reviewsdemand for th
- Page 299 and 300:
2011: Data and ReviewsAzerbaijanArm
- Page 301 and 302:
2011: Data and Reviewswere consider
- Page 303 and 304:
2011: Data and Reviews2008 2009 201
- Page 305 and 306:
2011: Data and Reviewsa) Economic g
- Page 307 and 308:
2011: Data and Reviewsa) Economic g
- Page 309 and 310:
2011: Data and Reviewsa) Economic g
- Page 311 and 312:
2011: Data and Reviewsa) Economic g
- Page 313 and 314:
2011: Data and ReviewsPriority Area
- Page 315 and 316:
2011: Data and ReviewsMoreover, IFC
- Page 317 and 318:
2011: Data and ReviewsIn addition,
- Page 319 and 320:
2011: Data and ReviewsADB published
- Page 321 and 322:
2011: Data and ReviewsThe EBRD and
- Page 323 and 324:
2011: Data and ReviewsAsian Develop
- Page 325 and 326:
2011: Data and Reviewsestimates tha
- Page 327 and 328:
2011: Data and Reviews3. MDB’s pr
- Page 329 and 330:
2011: Data and Reviewsin Interactiv
- Page 331 and 332:
2011: Data and ReviewsMoreover, in
- Page 333 and 334:
2011: Data and ReviewsEBRD extended
- Page 335 and 336:
2011: Data and ReviewsThe Bank exte
- Page 337 and 338:
2011: Data and Reviewsbalance sheet
- Page 339 and 340:
2011: Data and ReviewsThe ADB Board
- Page 341 and 342:
2011: Data and ReviewsIn addition,
- Page 343 and 344:
2011: Data and ReviewsIslamic Devel
- Page 345 and 346:
Information for authorsInformation
- Page 347 and 348:
IndexIndexaccession 16, 19, 62, 63,
- Page 349 and 350:
Indexreserves 280single 22, 33, 54,
- Page 351 and 352:
Indexfinancial integration 15, 231,
- Page 353 and 354:
Indexlabourdivision of 20, 63,64mar
- Page 355 and 356:
Indexnatural 36, 63, 139, 327respon
- Page 357 and 358:
Indexwatermanagement 104, 225-228re
- Page 359 and 360:
Report no.1Ukraine and the Customs
- Page 362:
EDB Eurasian Integration YearbookTh