Download Abstracts Here - IGAC Project
Download Abstracts Here - IGAC Project
Download Abstracts Here - IGAC Project
You also want an ePaper? Increase the reach of your titles
YUMPU automatically turns print PDFs into web optimized ePapers that Google loves.
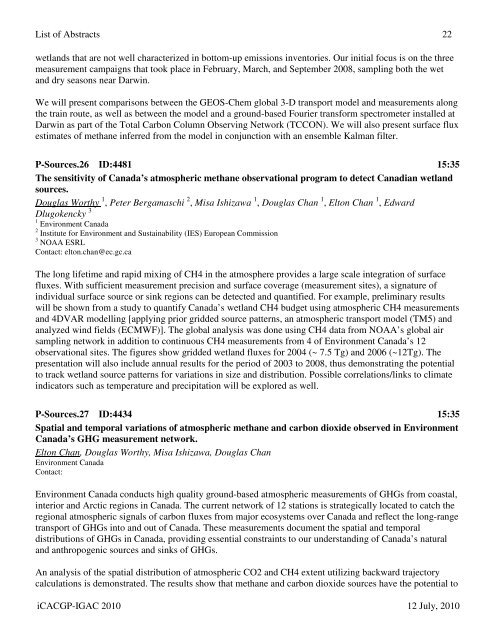
List of <strong>Abstracts</strong> 22wetlands that are not well characterized in bottom-up emissions inventories. Our initial focus is on the threemeasurement campaigns that took place in February, March, and September 2008, sampling both the wetand dry seasons near Darwin.We will present comparisons between the GEOS-Chem global 3-D transport model and measurements alongthe train route, as well as between the model and a ground-based Fourier transform spectrometer installed atDarwin as part of the Total Carbon Column Observing Network (TCCON). We will also present surface fluxestimates of methane inferred from the model in conjunction with an ensemble Kalman filter.P-Sources.26 ID:4481 15:35The sensitivity of Canada’s atmospheric methane observational program to detect Canadian wetlandsources.Douglas Worthy 1 , Peter Bergamaschi 2 , Misa Ishizawa 1 , Douglas Chan 1 , Elton Chan 1 , EdwardDlugokencky 31 Environment Canada2 Institute for Environment and Sustainability (IES) European Commission3 NOAA ESRLContact: elton.chan@ec.gc.caThe long lifetime and rapid mixing of CH4 in the atmosphere provides a large scale integration of surfacefluxes. With sufficient measurement precision and surface coverage (measurement sites), a signature ofindividual surface source or sink regions can be detected and quantified. For example, preliminary resultswill be shown from a study to quantify Canada’s wetland CH4 budget using atmospheric CH4 measurementsand 4DVAR modelling [applying prior gridded source patterns, an atmospheric transport model (TM5) andanalyzed wind fields (ECMWF)]. The global analysis was done using CH4 data from NOAA’s global airsampling network in addition to continuous CH4 measurements from 4 of Environment Canada’s 12observational sites. The figures show gridded wetland fluxes for 2004 (~ 7.5 Tg) and 2006 (~12Tg). Thepresentation will also include annual results for the period of 2003 to 2008, thus demonstrating the potentialto track wetland source patterns for variations in size and distribution. Possible correlations/links to climateindicators such as temperature and precipitation will be explored as well.P-Sources.27 ID:4434 15:35Spatial and temporal variations of atmospheric methane and carbon dioxide observed in EnvironmentCanada’s GHG measurement network.Elton Chan, Douglas Worthy, Misa Ishizawa, Douglas ChanEnvironment CanadaContact:Environment Canada conducts high quality ground-based atmospheric measurements of GHGs from coastal,interior and Arctic regions in Canada. The current network of 12 stations is strategically located to catch theregional atmospheric signals of carbon fluxes from major ecosystems over Canada and reflect the long-rangetransport of GHGs into and out of Canada. These measurements document the spatial and temporaldistributions of GHGs in Canada, providing essential constraints to our understanding of Canada’s naturaland anthropogenic sources and sinks of GHGs.An analysis of the spatial distribution of atmospheric CO2 and CH4 extent utilizing backward trajectorycalculations is demonstrated. The results show that methane and carbon dioxide sources have the potential toiCACGP-<strong>IGAC</strong> 2010 12 July, 2010


