15 MB - Great Lakes Maritime Research Institute
15 MB - Great Lakes Maritime Research Institute
15 MB - Great Lakes Maritime Research Institute
Create successful ePaper yourself
Turn your PDF publications into a flip-book with our unique Google optimized e-Paper software.
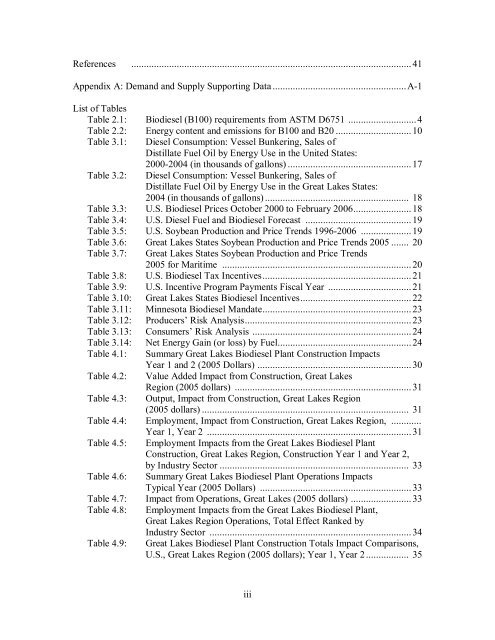
References ............................................................................................................... 41Appendix A: Demand and Supply Supporting Data .....................................................A1List of TablesTable 2.1: Biodiesel (B100) requirements from ASTM D6751 ...........................4Table 2.2: Energy content and emissions for B100 and B20 .............................. 10Table 3.1: Diesel Consumption: Vessel Bunkering, Sales ofDistillate Fuel Oil by Energy Use in the United States:Table 3.2:20002004 (in thousands of gallons) ................................................. 17Diesel Consumption: Vessel Bunkering, Sales ofDistillate Fuel Oil by Energy Use in the <strong>Great</strong> <strong>Lakes</strong> States:2004 (in thousands of gallons) ......................................................... 18Table 3.3: U.S. Biodiesel Prices October 2000 to February 2006....................... 18Table 3.4: U.S. Diesel Fuel and Biodiesel Forecast .......................................... 19Table 3.5: U.S. Soybean Production and Price Trends 19962006 .................... 19Table 3.6: <strong>Great</strong> <strong>Lakes</strong> States Soybean Production and Price Trends 2005 ....... 20Table 3.7:<strong>Great</strong> <strong>Lakes</strong> States Soybean Production and Price Trends2005 for <strong>Maritime</strong> ........................................................................... 20Table 3.8: U.S. Biodiesel Tax Incentives........................................................... 21Table 3.9: U.S. Incentive Program Payments Fiscal Year ................................. 21Table 3.10: <strong>Great</strong> <strong>Lakes</strong> States Biodiesel Incentives............................................ 22Table 3.11: Minnesota Biodiesel Mandate........................................................... 23Table 3.12: Producers’ Risk Analysis.................................................................. 23Table 3.13: Consumers’ Risk Analysis ............................................................... 24Table 3.14: Net Energy Gain (or loss) by Fuel..................................................... 24Table 4.1: Summary <strong>Great</strong> <strong>Lakes</strong> Biodiesel Plant Construction ImpactsYear 1 and 2 (2005 Dollars) ............................................................. 30Table 4.2: Value Added Impact from Construction, <strong>Great</strong> <strong>Lakes</strong>Region (2005 dollars) ...................................................................... 31Table 4.3: Output, Impact from Construction, <strong>Great</strong> <strong>Lakes</strong> Region(2005 dollars) .................................................................................. 31Table 4.4: Employment, Impact from Construction, <strong>Great</strong> <strong>Lakes</strong> Region, ............Table 4.5:Year 1, Year 2 ................................................................................. 31Employment Impacts from the <strong>Great</strong> <strong>Lakes</strong> Biodiesel PlantConstruction, <strong>Great</strong> <strong>Lakes</strong> Region, Construction Year 1 and Year 2,by Industry Sector ........................................................................... 33Table 4.6: Summary <strong>Great</strong> <strong>Lakes</strong> Biodiesel Plant Operations ImpactsTypical Year (2005 Dollars) ............................................................ 33Table 4.7: Impact from Operations, <strong>Great</strong> <strong>Lakes</strong> (2005 dollars) ........................ 33Table 4.8:Table 4.9:Employment Impacts from the <strong>Great</strong> <strong>Lakes</strong> Biodiesel Plant,<strong>Great</strong> <strong>Lakes</strong> Region Operations, Total Effect Ranked byIndustry Sector ................................................................................ 34<strong>Great</strong> <strong>Lakes</strong> Biodiesel Plant Construction Totals Impact Comparisons,U.S., <strong>Great</strong> <strong>Lakes</strong> Region (2005 dollars); Year 1, Year 2................. 35iii


