- Page 3 and 4:
Mission StatementThe Great Lakes Ma
- Page 5 and 6:
Technical Report Documentation1. Re
- Page 7 and 8:
TABLE OF CONTENTSOverview and Backg
- Page 9 and 10:
Overview and Background:During Marc
- Page 11 and 12:
Advisory Board:One of the first tas
- Page 13 and 14:
University of MichiganDr. Armin Tro
- Page 15 and 16:
Specific Project Awards to Universi
- Page 17 and 18:
- October 8, 2005 GLMRI Affiliate U
- Page 19 and 20:
- October 7, 2006 The 2 nd GLMRI Af
- Page 21 and 22:
SeawaySized Bulk Carrier Model fo
- Page 23 and 24:
Table of Contentspage1. Introductio
- Page 25 and 26:
List of FigurespageFigure 2.1: Typi
- Page 27 and 28:
2. BackgroundThe initial Sea Grant
- Page 29 and 30:
Figure 2.2: Typical Forward Plenum
- Page 31 and 32:
Table 3.1: BallastFree Bulk Carri
- Page 33 and 34:
4. Model Construction ConstraintsTh
- Page 35 and 36:
6. Computational Fluid Dynamics (CF
- Page 37 and 38:
Figure 6.3: Velocity Vectors at the
- Page 39 and 40:
8. Model ConstructionThe model of t
- Page 41 and 42:
9. Potential Economic Impacts of th
- Page 43:
Expanding Regional Freight Informat
- Page 47 and 48:
___________________________________
- Page 49 and 50:
Workshop participants also effectiv
- Page 51 and 52:
information to share with governmen
- Page 53 and 54:
Most of this information has been c
- Page 55 and 56:
A New Perspective on Information De
- Page 57 and 58:
• Assemble data and report inform
- Page 59 and 60:
Looking Ahead: Next StepsThe main o
- Page 61 and 62:
Again, according to MISNA, the mari
- Page 63:
References Cited[1] Maritime Inform
- Page 67:
Schematic Diagram of the Structure
- Page 71 and 72:
Example 1: Basic Mapping FunctionsF
- Page 73 and 74:
Figure B.7User now queries the port
- Page 75 and 76:
Example 3: Mapping the NetworkFigur
- Page 77:
APPENDIX CCode Specifications for G
- Page 80 and 81:
Michigan: 01 Alpena 19 Marine C
- Page 83:
APPENDIX DMeeting Participants in t
- Page 86:
Tax Systems and Barriersto Great La
- Page 89 and 90:
This page intentionally left blank.
- Page 91 and 92:
The HMT Generates Substantially Mor
- Page 93 and 94:
vii
- Page 95 and 96:
paid by the now terminated Incan Su
- Page 97 and 98:
Chapter 1: Introduction1.1 Research
- Page 99 and 100:
presentation, “A Transportation I
- Page 101 and 102:
− United States General Accountin
- Page 103 and 104:
− Short Sea Vessel Service and Ha
- Page 105 and 106:
Detailed views of these data presen
- Page 107 and 108:
Guarantee Fee for MARAD'sTitle XI P
- Page 109 and 110:
Table 2.4: Great Lakes Assessments
- Page 111 and 112:
Table 2.5: Great Lakes Assessments
- Page 113 and 114:
Table 2.7: Great Lakes Assessments
- Page 115 and 116:
Table 2.10: Duty Assessments on Gre
- Page 117 and 118:
Certification Fee for Payment of Ve
- Page 119 and 120:
6) HMT TablesAs noted above and in
- Page 121 and 122:
Table 2.14: Total Bid Dollars by Co
- Page 123 and 124:
2003 Arcadia Harbor, Mi $33,2462003
- Page 125 and 126:
Chapter 3: The U.S. Harbor Maintena
- Page 127 and 128:
providing for - (1) revenue from im
- Page 129 and 130:
Community’s RC. No panel has been
- Page 131 and 132:
evenue to fund current and future h
- Page 133 and 134:
The Support for Harbor Investment P
- Page 135 and 136:
Table 3.3: Percent Change in U.S. F
- Page 137 and 138:
Harbor Maintenance Tax Time Line198
- Page 139 and 140:
Table 4.3: Output ImpactIndustry Di
- Page 141 and 142:
ReferencesChapter 1[1] Stewart, Ric
- Page 143 and 144:
[31] United States V. United States
- Page 145 and 146:
[66] American Association of Port A
- Page 147 and 148:
Appendix A: Tax Inventory DataSourc
- Page 149 and 150:
Overview of Maritime Tax Inventory
- Page 151 and 152: Overview of Maritime Tax Inventory
- Page 153 and 154: Overview of Maritime Tax Inventory
- Page 155 and 156: 31 U.S.C. 9701; P.L. 100-710, 46 C.
- Page 157 and 158: Merchant Marine Act of 1936 as amen
- Page 159 and 160: Reform Act of 1998, P. L. 105-258,
- Page 161 and 162: Appendix C: Detailed HMT TimelineHA
- Page 163 and 164: complete and refunds are issued.Imp
- Page 165 and 166: There was unexpected good news for
- Page 167 and 168: Articles... assembled abroad in who
- Page 169 and 170: that each and every regulation is s
- Page 171 and 172: Another challenge to the HMF as app
- Page 173 and 174: Appendix D: Estimating Harbor Maint
- Page 175 and 176: D-3
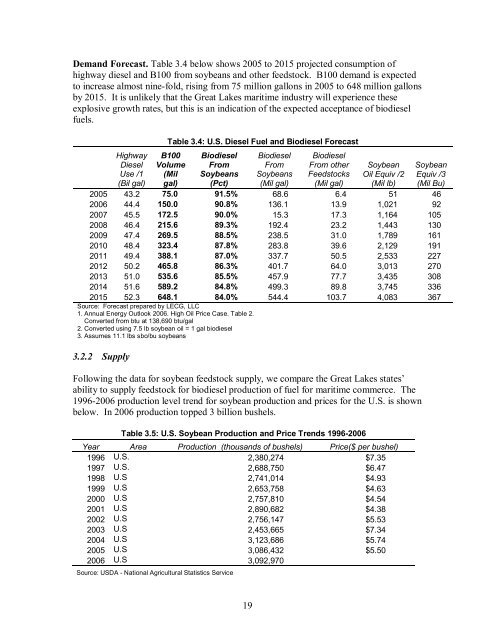
- Page 177 and 178: Alternatives to Petroleum Based Fue
- Page 179 and 180: Table of ContentsExecutive Summary
- Page 181 and 182: Table 4.10:Great Lakes Biodiesel Pl
- Page 183 and 184: of a longterm lowtemperature st
- Page 185 and 186: Chapter 1: Overview1.1 Introduction
- Page 187 and 188: Chapter 2: Biodiesel: An Alternativ
- Page 189 and 190: 2.2.2 Properties of BiodieselThe pr
- Page 191 and 192: e renewable fuels (e.g. ethanol and
- Page 193 and 194: 2.4 Engine Test DataSummaries of th
- Page 195 and 196: OEM manufacturer should be consulte
- Page 197 and 198: A review of the literature addressi
- Page 199 and 200: credit and a biodiesel mixture cred
- Page 201: Figure 2: U.S. Diesel DemandMoving
- Page 205 and 206: fuels (ethanol and biodiesel) be us
- Page 207 and 208: Minnesota incentivesTable 3.11: Min
- Page 209 and 210: Figure 3: Glycerin as Market RiskSo
- Page 211 and 212: Figure 4: Great Lakes Region IMPLAN
- Page 213 and 214: Definitions used in this report:Mea
- Page 215 and 216: column shows that in Year 1 of cons
- Page 217 and 218: Operations. Tables below show the e
- Page 219 and 220: When operations for the biodiesel p
- Page 221 and 222: verify that separation of the blend
- Page 223 and 224: was considered the hot topic, very
- Page 225 and 226: ReferencesChapter 1No referencesCha
- Page 227 and 228: http://www.irs.gov/publications/p37
- Page 229 and 230: Appendix A: Demand and Supply Suppo
- Page 231 and 232: Table A2: Minnesota Soybean Produ
- Page 233 and 234: Table A6: Marine Diesel Sales, Co
- Page 236: Table of ContentsSections Page #1.
- Page 239 and 240: 2. Introduction: Background and Obj
- Page 241 and 242: 3. MethodsThe LLO has a surveygra
- Page 243 and 244: Figure 2. Sidescan sonar mosaic of
- Page 245 and 246: Figure 4. Single track (detailed) s
- Page 247 and 248: Figure 7. Single track (detailed) s
- Page 249 and 250: Figure 10. Detailed multibeam bathy
- Page 251 and 252: 5. Potential Economic Impacts of th
- Page 253 and 254:
Final Report: Great Lakes Maritime
- Page 255 and 256:
Evaluation Measures and ResultsTo e
- Page 257 and 258:
Appendix ASummary of Publicity & Re
- Page 259 and 260:
Appendix BGreat Lakes Maritime Tran
- Page 261 and 262:
Appendix DGreat Lakes Maritime Tran
- Page 263 and 264:
REFERENCESDuluth Port Authority. 20
- Page 265 and 266:
Steel Starts Here (12:00 minutes) b
- Page 267 and 268:
Appendix FGreat Lakes Shipping: Did
- Page 269 and 270:
15. What are the top 3 products shi
- Page 271 and 272:
Properly Loaded Ship Listing ShipHO
- Page 273 and 274:
FoghornGreenhouse gasGroundedHarbor