Thematic Household Survey Report No. 52 主題性住戶統計調查第52 ...
Thematic Household Survey Report No. 52 主題性住戶統計調查第52 ...
Thematic Household Survey Report No. 52 主題性住戶統計調查第52 ...
You also want an ePaper? Increase the reach of your titles
YUMPU automatically turns print PDFs into web optimized ePapers that Google loves.
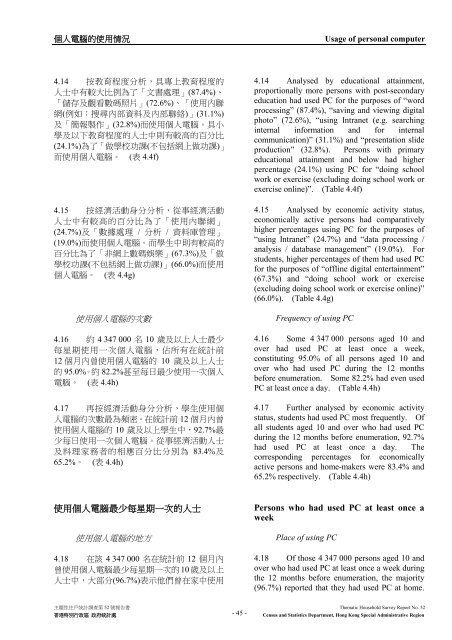
個 人 電 腦 的 使 用 情 況Usage of personal computer4.14 按 教 育 程 度 分 析 , 具 專 上 教 育 程 度 的人 士 中 有 較 大 比 例 為 了 「 文 書 處 理 」(87.4%)、「 儲 存 及 觀 看 數 碼 照 片 」(72.6%)、「 使 用 內 聯網 ( 例 如 : 搜 尋 內 部 資 料 及 內 部 聯 絡 )」(31.1%)及 「 簡 報 製 作 」(32.8%) 而 使 用 個 人 電 腦 。 具 小學 及 以 下 教 育 程 度 的 人 士 中 則 有 較 高 的 百 分 比(24.1%) 為 了 「 做 學 校 功 課 ( 不 包 括 網 上 做 功 課 )」而 使 用 個 人 電 腦 。 ( 表 4.4f)4.15 按 經 濟 活 動 身 分 分 析 , 從 事 經 濟 活 動人 士 中 有 較 高 的 百 分 比 為 了 「 使 用 內 聯 網 」(24.7%) 及 「 數 據 處 理 / 分 析 / 資 料 庫 管 理 」(19.0%) 而 使 用 個 人 電 腦 。 而 學 生 中 則 有 較 高 的百 分 比 為 了 「 非 網 上 數 碼 娛 樂 」(67.3%) 及 「 做學 校 功 課 ( 不 包 括 網 上 做 功 課 )」(66.0%) 而 使 用個 人 電 腦 。 ( 表 4.4g)使 用 個 人 電 腦 的 次 數4.16 約 4 347 000 名 10 歲 及 以 上 人 士 最 少每 星 期 使 用 一 次 個 人 電 腦 , 佔 所 有 在 統 計 前12 個 月 內 曾 使 用 個 人 電 腦 的 10 歲 及 以 上 人 士的 95.0%。 約 82.2% 甚 至 每 日 最 少 使 用 一 次 個 人電 腦 。 ( 表 4.4h)4.17 再 按 經 濟 活 動 身 分 分 析 , 學 生 使 用 個人 電 腦 的 次 數 最 為 頻 密 。 在 統 計 前 12 個 月 內 曾使 用 個 人 電 腦 的 10 歲 及 以 上 學 生 中 ,92.7% 最少 每 日 使 用 一 次 個 人 電 腦 。 從 事 經 濟 活 動 人 士及 料 理 家 務 者 的 相 應 百 分 比 分 別 為 83.4% 及65.2%。 ( 表 4.4h)4.14 Analysed by educational attainment,proportionally more persons with post-secondaryeducation had used PC for the purposes of “wordprocessing” (87.4%), “saving and viewing digitalphoto” (72.6%), “using Intranet (e.g. searchinginternal information and for internalcommunication)” (31.1%) and “presentation slideproduction” (32.8%). Persons with primaryeducational attainment and below had higherpercentage (24.1%) using PC for “doing schoolwork or exercise (excluding doing school work orexercise online)”. (Table 4.4f)4.15 Analysed by economic activity status,economically active persons had comparativelyhigher percentages using PC for the purposes of“using Intranet” (24.7%) and “data processing /analysis / database management” (19.0%). Forstudents, higher percentages of them had used PCfor the purposes of “offline digital entertainment”(67.3%) and “doing school work or exercise(excluding doing school work or exercise online)”(66.0%). (Table 4.4g)Frequency of using PC4.16 Some 4 347 000 persons aged 10 andover had used PC at least once a week,constituting 95.0% of all persons aged 10 andover who had used PC during the 12 monthsbefore enumeration. Some 82.2% had even usedPC at least once a day. (Table 4.4h)4.17 Further analysed by economic activitystatus, students had used PC most frequently. Ofall students aged 10 and over who had used PCduring the 12 months before enumeration, 92.7%had used PC at least once a day. Thecorresponding percentages for economicallyactive persons and home-makers were 83.4% and65.2% respectively. (Table 4.4h)使 用 個 人 電 腦 最 少 每 星 期 一 次 的 人 士使 用 個 人 電 腦 的 地 方4.18 在 該 4 347 000 名 在 統 計 前 12 個 月 內曾 使 用 個 人 電 腦 最 少 每 星 期 一 次 的 10 歲 及 以 上人 士 中 , 大 部 分 (96.7%) 表 示 他 們 曾 在 家 中 使 用Persons who had used PC at least once aweekPlace of using PC4.18 Of those 4 347 000 persons aged 10 andover who had used PC at least once a week duringthe 12 months before enumeration, the majority(96.7%) reported that they had used PC at home.主 題 性 住 戶 統 計 調 查 第 <strong>52</strong> 號 報 告 書 <strong>Thematic</strong> <strong>Household</strong> <strong>Survey</strong> <strong>Report</strong> <strong>No</strong>. <strong>52</strong>香 港 特 別 行 政 區 政 府 統 計 處- 45 -Census and Statistics Department, Hong Kong Special Administrative Region


