Thematic Household Survey Report No. 52 主題性住戶統計調查第52 ...
Thematic Household Survey Report No. 52 主題性住戶統計調查第52 ...
Thematic Household Survey Report No. 52 主題性住戶統計調查第52 ...

You also want an ePaper? Increase the reach of your titles
YUMPU automatically turns print PDFs into web optimized ePapers that Google loves.
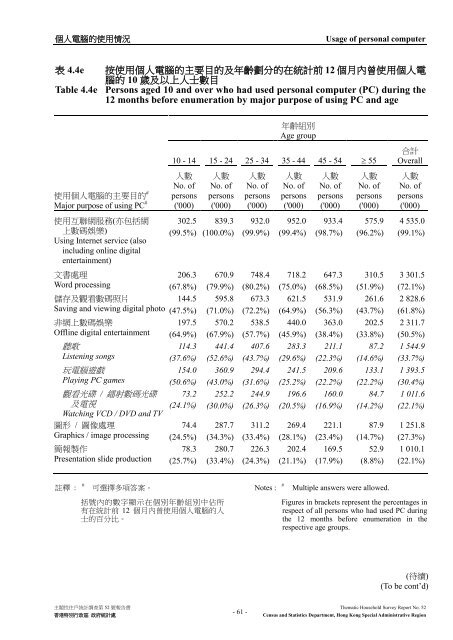
個 人 電 腦 的 使 用 情 況Usage of personal computer表 4.4e 按 使 用 個 人 電 腦 的 主 要 目 的 及 年 齡 劃 分 的 在 統 計 前 12 個 月 內 曾 使 用 個 人 電腦 的 10 歲 及 以 上 人 士 數 目Table 4.4e Persons aged 10 and over who had used personal computer (PC) during the12 months before enumeration by major purpose of using PC and age#使 用 個 人 電 腦 的 主 要 目 的Major purpose of using PC #使 用 互 聯 網 服 務 ( 亦 包 括 網上 數 碼 娛 樂 )Using Internet service (alsoincluding online digitalentertainment)文 書 處 理Word processing儲 存 及 觀 看 數 碼 照 片Saving and viewing digital photo非 網 上 數 碼 娛 樂Offline digital entertainment聽 歌Listening songs玩 電 腦 遊 戲Playing PC games觀 看 光 碟 / 鐳 射 數 碼 光 碟及 電 視Watching VCD / DVD and TV圖 形 / 圖 像 處 理Graphics / image processing簡 報 製 作Presentation slide production年 齡 組 別Age group10 - 14 15 - 24 25 - 34 35 - 44 45 - 54 ≥ 55人 數<strong>No</strong>. ofpersons('000)人 數<strong>No</strong>. ofpersons('000)人 數<strong>No</strong>. ofpersons('000)人 數<strong>No</strong>. ofpersons('000)人 數<strong>No</strong>. ofpersons('000)人 數<strong>No</strong>. ofpersons('000)合 計Overall人 數<strong>No</strong>. ofpersons('000)302.5 839.3 932.0 9<strong>52</strong>.0 933.4 575.9 4 535.0(99.5%) (100.0%) (99.9%) (99.4%) (98.7%) (96.2%) (99.1%)206.3 670.9 748.4 718.2 647.3 310.5 3 301.5(67.8%) (79.9%) (80.2%) (75.0%) (68.5%) (51.9%) (72.1%)144.5 595.8 673.3 621.5 531.9 261.6 2 828.6(47.5%) (71.0%) (72.2%) (64.9%) (56.3%) (43.7%) (61.8%)197.5 570.2 538.5 440.0 363.0 202.5 2 311.7(64.9%) (67.9%) (57.7%) (45.9%) (38.4%) (33.8%) (50.5%)114.3 441.4 407.6 283.3 211.1 87.2 1 544.9(37.6%) (<strong>52</strong>.6%) (43.7%) (29.6%) (22.3%) (14.6%) (33.7%)154.0 360.9 294.4 241.5 209.6 133.1 1 393.5(50.6%) (43.0%) (31.6%) (25.2%) (22.2%) (22.2%) (30.4%)73.2 2<strong>52</strong>.2 244.9 196.6 160.0 84.7 1 011.6(24.1%) (30.0%) (26.3%) (20.5%) (16.9%) (14.2%) (22.1%)74.4 287.7 311.2 269.4 221.1 87.9 1 251.8(24.5%) (34.3%) (33.4%) (28.1%) (23.4%) (14.7%) (27.3%)78.3 280.7 226.3 202.4 169.5 <strong>52</strong>.9 1 010.1(25.7%) (33.4%) (24.3%) (21.1%) (17.9%) (8.8%) (22.1%)註 釋 :#可 選 擇 多 項 答 案 。 <strong>No</strong>tes : # Multiple answers were allowed.括 號 內 的 數 字 顯 示 在 個 別 年 齡 組 別 中 佔 所有 在 統 計 前 12 個 月 內 曾 使 用 個 人 電 腦 的 人士 的 百 分 比 。Figures in brackets represent the percentages inrespect of all persons who had used PC duringthe 12 months before enumeration in therespective age groups.( 待 續 )(To be cont’d)主 題 性 住 戶 統 計 調 查 第 <strong>52</strong> 號 報 告 書 <strong>Thematic</strong> <strong>Household</strong> <strong>Survey</strong> <strong>Report</strong> <strong>No</strong>. <strong>52</strong>香 港 特 別 行 政 區 政 府 統 計 處- 61 -Census and Statistics Department, Hong Kong Special Administrative Region