Thematic Household Survey Report No. 52 主題性住戶統計調查第52 ...
Thematic Household Survey Report No. 52 主題性住戶統計調查第52 ...
Thematic Household Survey Report No. 52 主題性住戶統計調查第52 ...

Create successful ePaper yourself
Turn your PDF publications into a flip-book with our unique Google optimized e-Paper software.
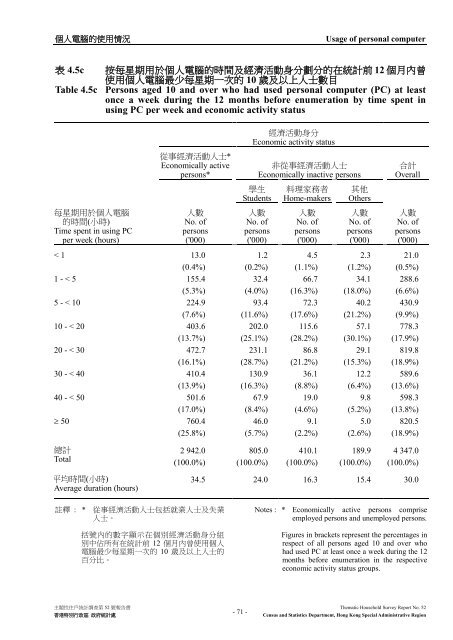
個 人 電 腦 的 使 用 情 況Usage of personal computer表 4.5c 按 每 星 期 用 於 個 人 電 腦 的 時 間 及 經 濟 活 動 身 分 劃 分 的 在 統 計 前 12 個 月 內 曾使 用 個 人 電 腦 最 少 每 星 期 一 次 的 10 歲 及 以 上 人 士 數 目Table 4.5c Persons aged 10 and over who had used personal computer (PC) at leastonce a week during the 12 months before enumeration by time spent inusing PC per week and economic activity status每 星 期 用 於 個 人 電 腦的 時 間 ( 小 時 )Time spent in using PCper week (hours)從 事 經 濟 活 動 人 士 *Economically activepersons*人 數<strong>No</strong>. ofpersons('000)經 濟 活 動 身 分Economic activity status非 從 事 經 濟 活 動 人 士Economically inactive persons學 生Students人 數<strong>No</strong>. ofpersons('000)料 理 家 務 者Home-makers人 數<strong>No</strong>. ofpersons('000)其 他Others人 數<strong>No</strong>. ofpersons('000)合 計Overall人 數<strong>No</strong>. ofpersons('000)< 1 13.0 1.2 4.5 2.3 21.0(0.4%) (0.2%) (1.1%) (1.2%) (0.5%)1 - < 5 155.4 32.4 66.7 34.1 288.6(5.3%) (4.0%) (16.3%) (18.0%) (6.6%)5 - < 10 224.9 93.4 72.3 40.2 430.9(7.6%) (11.6%) (17.6%) (21.2%) (9.9%)10 - < 20 403.6 202.0 115.6 57.1 778.3(13.7%) (25.1%) (28.2%) (30.1%) (17.9%)20 - < 30 472.7 231.1 86.8 29.1 819.8(16.1%) (28.7%) (21.2%) (15.3%) (18.9%)30 - < 40 410.4 130.9 36.1 12.2 589.6(13.9%) (16.3%) (8.8%) (6.4%) (13.6%)40 - < 50 501.6 67.9 19.0 9.8 598.3(17.0%) (8.4%) (4.6%) (5.2%) (13.8%)≥ 50 760.4 46.0 9.1 5.0 820.5(25.8%) (5.7%) (2.2%) (2.6%) (18.9%)總 計Total平 均 時 間 ( 小 時 )Average duration (hours)2 942.0 805.0 410.1 189.9 4 347.0(100.0%) (100.0%) (100.0%) (100.0%) (100.0%)34.5 24.0 16.3 15.4 30.0註 釋 : *從 事 經 濟 活 動 人 士 包 括 就 業 人 士 及 失 業人 士 。<strong>No</strong>tes : * Economically active persons compriseemployed persons and unemployed persons.括 號 內 的 數 字 顯 示 在 個 別 經 濟 活 動 身 分 組別 中 佔 所 有 在 統 計 前 12 個 月 內 曾 使 用 個 人電 腦 最 少 每 星 期 一 次 的 10 歲 及 以 上 人 士 的百 分 比 。Figures in brackets represent the percentages inrespect of all persons aged 10 and over whohad used PC at least once a week during the 12months before enumeration in the respectiveeconomic activity status groups.主 題 性 住 戶 統 計 調 查 第 <strong>52</strong> 號 報 告 書 <strong>Thematic</strong> <strong>Household</strong> <strong>Survey</strong> <strong>Report</strong> <strong>No</strong>. <strong>52</strong>香 港 特 別 行 政 區 政 府 統 計 處- 71 -Census and Statistics Department, Hong Kong Special Administrative Region