

Theory and Practice in Language Studies Contents - Academy ...
Theory and Practice in Language Studies Contents - Academy ...
Theory and Practice in Language Studies Contents - Academy ...

Create successful ePaper yourself
Turn your PDF publications into a flip-book with our unique Google optimized e-Paper software.
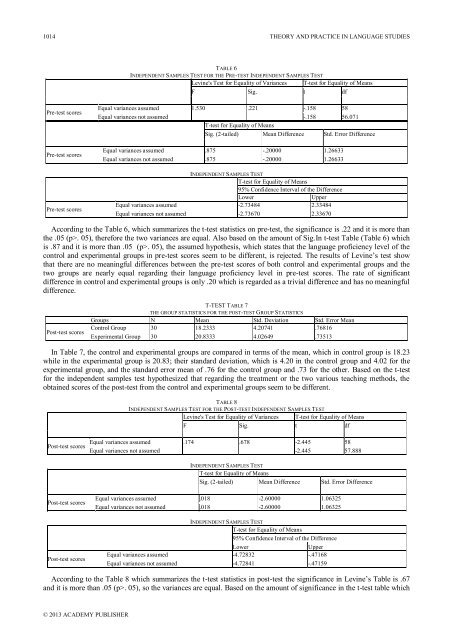
1014 THEORY AND PRACTICE IN LANGUAGE STUDIESTABLE 6INDEPENDENT SAMPLES TEST FOR THE PRE-TEST INDEPENDENT SAMPLES TESTLev<strong>in</strong>e's Test for Equality of Variances T-test for Equality of MeansF Sig. t dfPre-test scoresPre-test scoresPre-test scoresEqual variances assumed 1.530 .221 -.158 58Equal variances not assumed -.158 56.071T-test for Equality of MeansSig. (2-tailed) Mean Difference Std. Error DifferenceEqual variances assumed .875 -.20000 1.26633Equal variances not assumed .875 -.20000 1.26633INDEPENDENT SAMPLES TESTT-test for Equality of Means95% Confidence Interval of the DifferenceLowerUpperEqual variances assumed -2.73484 2.33484Equal variances not assumed -2.73670 2.33670Accord<strong>in</strong>g to the Table 6, which summarizes the t-test statistics on pre-test, the significance is .22 <strong>and</strong> it is more thanthe .05 (p>. 05), therefore the two variances are equal. Also based on the amount of Sig.In t-test Table (Table 6) whichis .87 <strong>and</strong> it is more than .05 (p>. 05), the assumed hypothesis, which states that the language proficiency level of thecontrol <strong>and</strong> experimental groups <strong>in</strong> pre-test scores seem to be different, is rejected. The results of Lev<strong>in</strong>e‟s test showthat there are no mean<strong>in</strong>gful differences between the pre-test scores of both control <strong>and</strong> experimental groups <strong>and</strong> thetwo groups are nearly equal regard<strong>in</strong>g their language proficiency level <strong>in</strong> pre-test scores. The rate of significantdifference <strong>in</strong> control <strong>and</strong> experimental groups is only .20 which is regarded as a trivial difference <strong>and</strong> has no mean<strong>in</strong>gfuldifference.Post-test scoresT-TEST TABLE 7THE GROUP STATISTICS FOR THE POST-TEST GROUP STATISTICSGroups N Mean Std. Deviation Std. Error MeanControl Group 30 18.2333 4.20741 .76816Experimental Group 30 20.8333 4.02649 .73513In Table 7, the control <strong>and</strong> experimental groups are compared <strong>in</strong> terms of the mean, which <strong>in</strong> control group is 18.23while <strong>in</strong> the experimental group is 20.83; their st<strong>and</strong>ard deviation, which is 4.20 <strong>in</strong> the control group <strong>and</strong> 4.02 for theexperimental group, <strong>and</strong> the st<strong>and</strong>ard error mean of .76 for the control group <strong>and</strong> .73 for the other. Based on the t-testfor the <strong>in</strong>dependent samples test hypothesized that regard<strong>in</strong>g the treatment or the two various teach<strong>in</strong>g methods, theobta<strong>in</strong>ed scores of the post-test from the control <strong>and</strong> experimental groups seem to be different.Post-test scoresTABLE 8INDEPENDENT SAMPLES TEST FOR THE POST-TEST INDEPENDENT SAMPLES TESTLev<strong>in</strong>e's Test for Equality of Variances T-test for Equality of MeansF Sig. t dfEqual variances assumed .174 .678 -2.445 58Equal variances not assumed -2.445 57.888INDEPENDENT SAMPLES TESTT-test for Equality of MeansSig. (2-tailed) Mean Difference Std. Error DifferencePost-test scoresPost-test scoresEqual variances assumed .018 -2.60000 1.06325Equal variances not assumed .018 -2.60000 1.06325INDEPENDENT SAMPLES TESTT-test for Equality of Means95% Confidence Interval of the DifferenceLowerUpperEqual variances assumed -4.72832 -.47168Equal variances not assumed -4.72841 -.47159Accord<strong>in</strong>g to the Table 8 which summarizes the t-test statistics <strong>in</strong> post-test the significance <strong>in</strong> Lev<strong>in</strong>e‟s Table is .67<strong>and</strong> it is more than .05 (p>. 05), so the variances are equal. Based on the amount of significance <strong>in</strong> the t-test table which© 2013 ACADEMY PUBLISHER


