

Theory and Practice in Language Studies Contents - Academy ...
Theory and Practice in Language Studies Contents - Academy ...
Theory and Practice in Language Studies Contents - Academy ...

You also want an ePaper? Increase the reach of your titles
YUMPU automatically turns print PDFs into web optimized ePapers that Google loves.
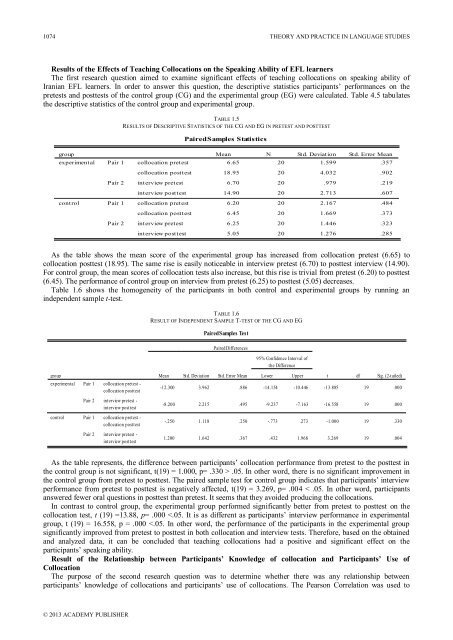
1074 THEORY AND PRACTICE IN LANGUAGE STUDIESResults of the Effects of Teach<strong>in</strong>g Collocations on the Speak<strong>in</strong>g Ability of EFL learnersThe first research question aimed to exam<strong>in</strong>e significant effects of teach<strong>in</strong>g collocations on speak<strong>in</strong>g ability ofIranian EFL learners. In order to answer this question, the descriptive statistics participants‟ performances on thepretests <strong>and</strong> posttests of the control group (CG) <strong>and</strong> the experimental group (EG) were calculated. Table 4.5 tabulatesthe descriptive statistics of the control group <strong>and</strong> experimental group.TABLE 1.5RESULTS OF DESCRIPTIVE STATISTICS OF THE CG AND EG IN PRETEST AND POSTTESTPaired Samples StatisticsgroupexperimentalPair 1collocation pretestMean N Std. Deviation Std. Error Mean6.65 20 1.599 .357collocation posttest18.95 20 4.032 .902Pair 2<strong>in</strong>terview pretest6.70 20 .979 .219<strong>in</strong>terview posttest14.90 20 2.713 .607controlPair 1collocation pretest6.20 20 2.167 .484collocation posttest6.45 20 1.669 .373Pair 2<strong>in</strong>terview pretest6.25 20 1.446 .323<strong>in</strong>terview posttest5.05 20 1.276 .285As the table shows the mean score of the experimental group has <strong>in</strong>creased from collocation pretest (6.65) tocollocation posttest (18.95). The same rise is easily noticeable <strong>in</strong> <strong>in</strong>terview pretest (6.70) to posttest <strong>in</strong>terview (14.90).For control group, the mean scores of collocation tests also <strong>in</strong>crease, but this rise is trivial from pretest (6.20) to posttest(6.45). The performance of control group on <strong>in</strong>terview from pretest (6.25) to posttest (5.05) decreases.Table 1.6 shows the homogeneity of the participants <strong>in</strong> both control <strong>and</strong> experimental groups by runn<strong>in</strong>g an<strong>in</strong>dependent sample t-test.TABLE 1.6RESULT OF INDEPENDENT SAMPLE T-TEST OF THE CG AND EGPaired Samples TestPaired Differences95% Confidence Interval ofthe DifferencegroupexperimentalPair 1collocation pretest -collocation posttestMean Std. Deviation Std. Error Mean Lower Uppert df Sig. (2-tailed)-12.300 3.962 .886 -14.154 -10.446 -13.885 19 .000Pair 2<strong>in</strong>terview pretest -<strong>in</strong>terview posttest-8.200 2.215 .495 -9.237 -7.163 -16.558 19 .000controlPair 1collocation pretest -collocation posttest-.250 1.118 .250 -.773 .273 -1.000 19 .330Pair 2<strong>in</strong>terview pretest -<strong>in</strong>terview posttest1.200 1.642 .367 .432 1.968 3.269 19 .004As the table represents, the difference between participants‟ collocation performance from pretest to the posttest <strong>in</strong>the control group is not significant, t(19) = 1.000, p= .330 > .05. In other word, there is no significant improvement <strong>in</strong>the control group from pretest to posttest. The paired sample test for control group <strong>in</strong>dicates that participants‟ <strong>in</strong>terviewperformance from pretest to posttest is negatively affected, t(19) = 3.269, p= .004 < .05. In other word, participantsanswered fewer oral questions <strong>in</strong> posttest than pretest. It seems that they avoided produc<strong>in</strong>g the collocations.In contrast to control group, the experimental group performed significantly better from pretest to posttest on thecollocation test, t (19) =13.88, p= .000


