

Theory and Practice in Language Studies Contents - Academy ...
Theory and Practice in Language Studies Contents - Academy ...
Theory and Practice in Language Studies Contents - Academy ...

You also want an ePaper? Increase the reach of your titles
YUMPU automatically turns print PDFs into web optimized ePapers that Google loves.
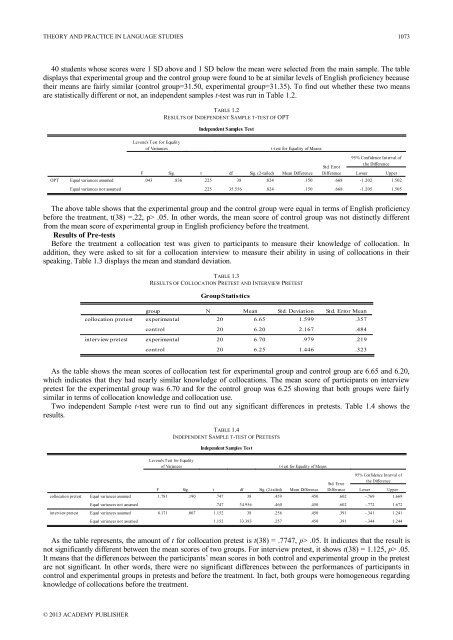
THEORY AND PRACTICE IN LANGUAGE STUDIES 107340 students whose scores were 1 SD above <strong>and</strong> 1 SD below the mean were selected from the ma<strong>in</strong> sample. The tabledisplays that experimental group <strong>and</strong> the control group were found to be at similar levels of English proficiency becausetheir means are fairly similar (control group=31.50, experimental group=31.35). To f<strong>in</strong>d out whether these two meansare statistically different or not, an <strong>in</strong>dependent samples t-test was run <strong>in</strong> Table 1.2.TABLE 1.2RESULTS OF INDEPENDENT SAMPLE T-TEST OF OPTIndependent Samples TestOPTEqual variances assumedEqual variances not assumedLevene's Test for Equalityof VariancesFSig.t-test for Equality of Meanst df Sig. (2-tailed) Mean Difference95% Confidence Interval ofthe DifferenceStd. ErrorDifference Lower Upper.043 .836 .225 38 .824 .150 .668 -1.202 1.502.225 35.556 .824 .150 .668 -1.205 1.505The above table shows that the experimental group <strong>and</strong> the control group were equal <strong>in</strong> terms of English proficiencybefore the treatment, t(38) =.22, p> .05. In other words, the mean score of control group was not dist<strong>in</strong>ctly differentfrom the mean score of experimental group <strong>in</strong> English proficiency before the treatment.Results of Pre-testsBefore the treatment a collocation test was given to participants to measure their knowledge of collocation. Inaddition, they were asked to sit for a collocation <strong>in</strong>terview to measure their ability <strong>in</strong> us<strong>in</strong>g of collocations <strong>in</strong> theirspeak<strong>in</strong>g. Table 1.3 displays the mean <strong>and</strong> st<strong>and</strong>ard deviation.TABLE 1.3RESULTS OF COLLOCATION PRETEST AND INTERVIEW PRETESTGroup Statisticscollocation pretest<strong>in</strong>terview pretestgroupexperimentalcontrolexperimentalcontrolN Mean Std. Deviation Std. Error Mean20 6.65 1.599 .35720 6.20 2.167 .48420 6.70 .979 .21920 6.25 1.446 .323As the table shows the mean scores of collocation test for experimental group <strong>and</strong> control group are 6.65 <strong>and</strong> 6.20,which <strong>in</strong>dicates that they had nearly similar knowledge of collocations. The mean score of participants on <strong>in</strong>terviewpretest for the experimental group was 6.70 <strong>and</strong> for the control group was 6.25 show<strong>in</strong>g that both groups were fairlysimilar <strong>in</strong> terms of collocation knowledge <strong>and</strong> collocation use.Two <strong>in</strong>dependent Sample t-test were run to f<strong>in</strong>d out any significant differences <strong>in</strong> pretests. Table 1.4 shows theresults.TABLE 1.4INDEPENDENT SAMPLE T-TEST OF PRETESTSIndependent Samples Testcollocation pretest<strong>in</strong>terview pretestEqual variances assumedEqual variances not assumedEqual variances assumedEqual variances not assumedLevene's Test for Equalityof VariancesFSig.t-test for Equality of Meanst df Sig. (2-tailed) Mean Difference95% Confidence Interval ofthe DifferenceStd. ErrorDifference Lower Upper1.781 .190 .747 38 .459 .450 .602 -.769 1.669.747 34.956 .460 .450 .602 -.772 1.6728.171 .007 1.152 38 .256 .450 .391 -.341 1.2411.152 33.383 .257 .450 .391 -.344 1.244As the table represents, the amount of t for collocation pretest is t(38) = .7747, p> .05. It <strong>in</strong>dicates that the result isnot significantly different between the mean scores of two groups. For <strong>in</strong>terview pretest, it shows t(38) = 1.125, p> .05.It means that the differences between the participants‟ mean scores <strong>in</strong> both control <strong>and</strong> experimental group <strong>in</strong> the pretestare not significant. In other words, there were no significant differences between the performances of participants <strong>in</strong>control <strong>and</strong> experimental groups <strong>in</strong> pretests <strong>and</strong> before the treatment. In fact, both groups were homogeneous regard<strong>in</strong>gknowledge of collocations before the treatment.© 2013 ACADEMY PUBLISHER


