Jackson County Program Evaluation Project Year 3, Report 1.pdf
Jackson County Program Evaluation Project Year 3, Report 1.pdf
Jackson County Program Evaluation Project Year 3, Report 1.pdf
Create successful ePaper yourself
Turn your PDF publications into a flip-book with our unique Google optimized e-Paper software.
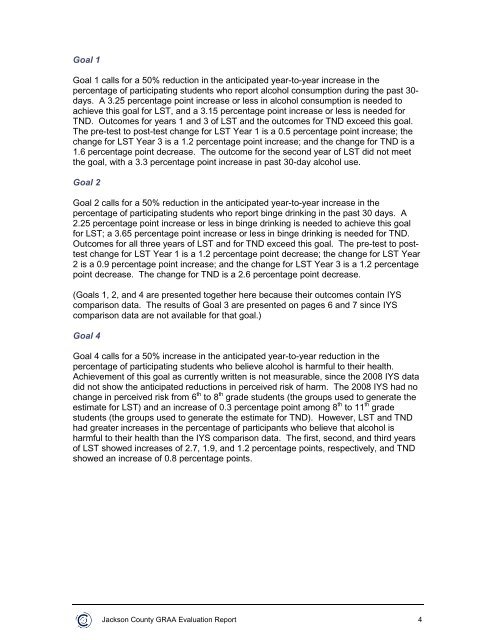
Goal 1Goal 1 calls for a 50% reduction in the anticipated year-to-year increase in thepercentage of participating students who report alcohol consumption during the past 30-days. A 3.25 percentage point increase or less in alcohol consumption is needed toachieve this goal for LST, and a 3.15 percentage point increase or less is needed forTND. Outcomes for years 1 and 3 of LST and the outcomes for TND exceed this goal.The pre-test to post-test change for LST <strong>Year</strong> 1 is a 0.5 percentage point increase; thechange for LST <strong>Year</strong> 3 is a 1.2 percentage point increase; and the change for TND is a1.6 percentage point decrease. The outcome for the second year of LST did not meetthe goal, with a 3.3 percentage point increase in past 30-day alcohol use.Goal 2Goal 2 calls for a 50% reduction in the anticipated year-to-year increase in thepercentage of participating students who report binge drinking in the past 30 days. A2.25 percentage point increase or less in binge drinking is needed to achieve this goalfor LST; a 3.65 percentage point increase or less in binge drinking is needed for TND.Outcomes for all three years of LST and for TND exceed this goal. The pre-test to posttestchange for LST <strong>Year</strong> 1 is a 1.2 percentage point decrease; the change for LST <strong>Year</strong>2 is a 0.9 percentage point increase; and the change for LST <strong>Year</strong> 3 is a 1.2 percentagepoint decrease. The change for TND is a 2.6 percentage point decrease.(Goals 1, 2, and 4 are presented together here because their outcomes contain IYScomparison data. The results of Goal 3 are presented on pages 6 and 7 since IYScomparison data are not available for that goal.)Goal 4Goal 4 calls for a 50% increase in the anticipated year-to-year reduction in thepercentage of participating students who believe alcohol is harmful to their health.Achievement of this goal as currently written is not measurable, since the 2008 IYS datadid not show the anticipated reductions in perceived risk of harm. The 2008 IYS had nochange in perceived risk from 6 th to 8 th grade students (the groups used to generate theestimate for LST) and an increase of 0.3 percentage point among 8 th to 11 th gradestudents (the groups used to generate the estimate for TND). However, LST and TNDhad greater increases in the percentage of participants who believe that alcohol isharmful to their health than the IYS comparison data. The first, second, and third yearsof LST showed increases of 2.7, 1.9, and 1.2 percentage points, respectively, and TNDshowed an increase of 0.8 percentage points.<strong>Jackson</strong> <strong>County</strong> GRAA <strong>Evaluation</strong> <strong>Report</strong> 4


