Jackson County Program Evaluation Project Year 3, Report 1.pdf
Jackson County Program Evaluation Project Year 3, Report 1.pdf
Jackson County Program Evaluation Project Year 3, Report 1.pdf

You also want an ePaper? Increase the reach of your titles
YUMPU automatically turns print PDFs into web optimized ePapers that Google loves.
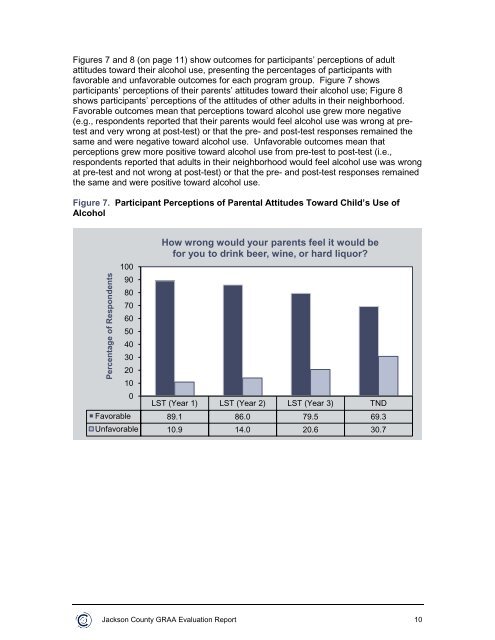
Figures 7 and 8 (on page 11) show outcomes for participants’ perceptions of adultattitudes toward their alcohol use, presenting the percentages of participants withfavorable and unfavorable outcomes for each program group. Figure 7 showsparticipants’ perceptions of their parents’ attitudes toward their alcohol use; Figure 8shows participants’ perceptions of the attitudes of other adults in their neighborhood.Favorable outcomes mean that perceptions toward alcohol use grew more negative(e.g., respondents reported that their parents would feel alcohol use was wrong at pretestand very wrong at post-test) or that the pre- and post-test responses remained thesame and were negative toward alcohol use. Unfavorable outcomes mean thatperceptions grew more positive toward alcohol use from pre-test to post-test (i.e.,respondents reported that adults in their neighborhood would feel alcohol use was wrongat pre-test and not wrong at post-test) or that the pre- and post-test responses remainedthe same and were positive toward alcohol use.Figure 7. Participant Perceptions of Parental Attitudes Toward Child’s Use ofAlcohol1009080706050403020100LST (<strong>Year</strong> 1) LST (<strong>Year</strong> 2) LST (<strong>Year</strong> 3) TNDFavorable 89.1 86.0 79.5 69.3Unfavorable 10.9 14.0 20.6 30.7Percentage of RespondentsHow wrong would your parents feel it would befor you to drink beer, wine, or hard liquor?<strong>Jackson</strong> <strong>County</strong> GRAA <strong>Evaluation</strong> <strong>Report</strong> 10