Jackson County Program Evaluation Project Year 3, Report 1.pdf
Jackson County Program Evaluation Project Year 3, Report 1.pdf
Jackson County Program Evaluation Project Year 3, Report 1.pdf

Create successful ePaper yourself
Turn your PDF publications into a flip-book with our unique Google optimized e-Paper software.
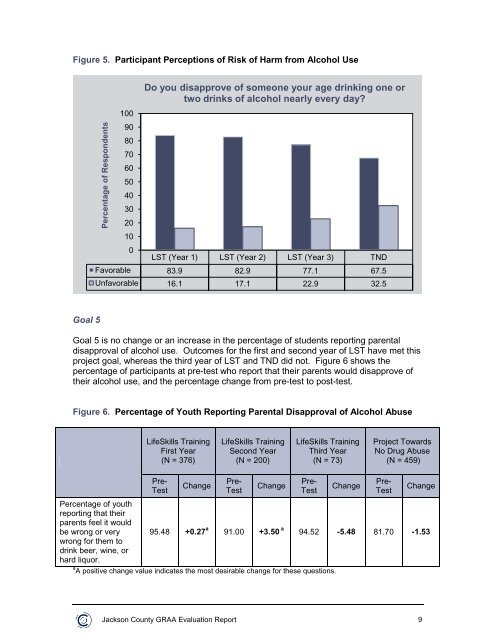
Figure 5. Participant Perceptions of Risk of Harm from Alcohol UsePercentage of Respondents100908070605040302010Do you disapprove of someone your age drinking one ortwo drinks of alcohol nearly every day?0LST (<strong>Year</strong> 1) LST (<strong>Year</strong> 2) LST (<strong>Year</strong> 3) TNDFavorable 83.9 82.9 77.1 67.5Unfavorable 16.1 17.1 22.9 32.5Goal 5Goal 5 is no change or an increase in the percentage of students reporting parentaldisapproval of alcohol use. Outcomes for the first and second year of LST have met thisproject goal, whereas the third year of LST and TND did not. Figure 6 shows thepercentage of participants at pre-test who report that their parents would disapprove oftheir alcohol use, and the percentage change from pre-test to post-test.Figure 6. Percentage of Youth <strong>Report</strong>ing Parental Disapproval of Alcohol AbuseLifeSkills TrainingFirst <strong>Year</strong>(N = 376)LifeSkills TrainingSecond <strong>Year</strong>(N = 200)LifeSkills TrainingThird <strong>Year</strong>(N = 73)<strong>Project</strong> TowardsNo Drug Abuse(N = 459)Pre-TestChangePre-TestChangePre-TestChangePre-TestChangePercentage of youthreporting that theirparents feel it wouldbe wrong or very 95.48 +0.27 a 91.00 +3.50 a 94.52 -5.48 81.70 -1.53wrong for them todrink beer, wine, orhard liquor.a A positive change value indicates the most desirable change for these questions.<strong>Jackson</strong> <strong>County</strong> GRAA <strong>Evaluation</strong> <strong>Report</strong> 9