Jackson County Program Evaluation Project Year 3, Report 1.pdf
Jackson County Program Evaluation Project Year 3, Report 1.pdf
Jackson County Program Evaluation Project Year 3, Report 1.pdf

Create successful ePaper yourself
Turn your PDF publications into a flip-book with our unique Google optimized e-Paper software.
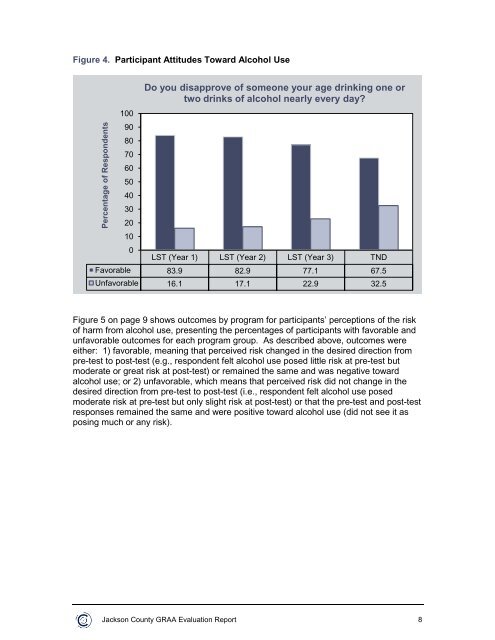
Figure 4. Participant Attitudes Toward Alcohol UsePercentage of Respondents100908070605040302010Do you disapprove of someone your age drinking one ortwo drinks of alcohol nearly every day?0LST (<strong>Year</strong> 1) LST (<strong>Year</strong> 2) LST (<strong>Year</strong> 3) TNDFavorable 83.9 82.9 77.1 67.5Unfavorable 16.1 17.1 22.9 32.5Figure 5 on page 9 shows outcomes by program for participants’ perceptions of the riskof harm from alcohol use, presenting the percentages of participants with favorable andunfavorable outcomes for each program group. As described above, outcomes wereeither: 1) favorable, meaning that perceived risk changed in the desired direction frompre-test to post-test (e.g., respondent felt alcohol use posed little risk at pre-test butmoderate or great risk at post-test) or remained the same and was negative towardalcohol use; or 2) unfavorable, which means that perceived risk did not change in thedesired direction from pre-test to post-test (i.e., respondent felt alcohol use posedmoderate risk at pre-test but only slight risk at post-test) or that the pre-test and post-testresponses remained the same and were positive toward alcohol use (did not see it asposing much or any risk).<strong>Jackson</strong> <strong>County</strong> GRAA <strong>Evaluation</strong> <strong>Report</strong> 8