Jackson County Program Evaluation Project Year 3, Report 1.pdf
Jackson County Program Evaluation Project Year 3, Report 1.pdf
Jackson County Program Evaluation Project Year 3, Report 1.pdf

Create successful ePaper yourself
Turn your PDF publications into a flip-book with our unique Google optimized e-Paper software.
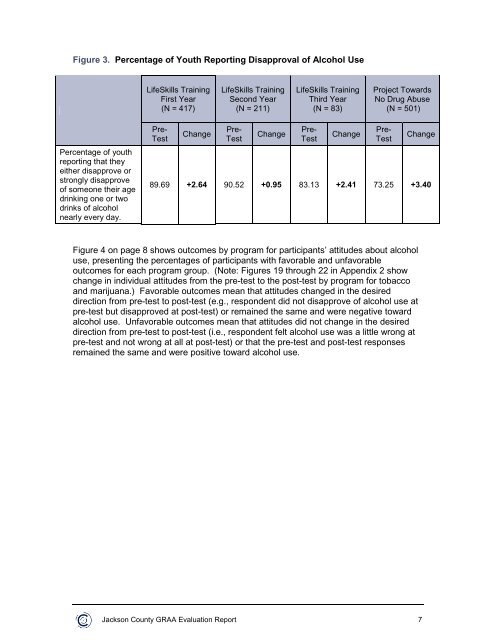
Figure 3. Percentage of Youth <strong>Report</strong>ing Disapproval of Alcohol UseLifeSkills TrainingFirst <strong>Year</strong>(N = 417)LifeSkills TrainingSecond <strong>Year</strong>(N = 211)LifeSkills TrainingThird <strong>Year</strong>(N = 83)<strong>Project</strong> TowardsNo Drug Abuse(N = 501)Percentage of youthreporting that theyeither disapprove orstrongly disapproveof someone their agedrinking one or twodrinks of alcoholnearly every day.Pre-TestChangePre-TestChangePre-TestChangePre-TestChange89.69 +2.64 90.52 +0.95 83.13 +2.41 73.25 +3.40Figure 4 on page 8 shows outcomes by program for participants’ attitudes about alcoholuse, presenting the percentages of participants with favorable and unfavorableoutcomes for each program group. (Note: Figures 19 through 22 in Appendix 2 showchange in individual attitudes from the pre-test to the post-test by program for tobaccoand marijuana.) Favorable outcomes mean that attitudes changed in the desireddirection from pre-test to post-test (e.g., respondent did not disapprove of alcohol use atpre-test but disapproved at post-test) or remained the same and were negative towardalcohol use. Unfavorable outcomes mean that attitudes did not change in the desireddirection from pre-test to post-test (i.e., respondent felt alcohol use was a little wrong atpre-test and not wrong at all at post-test) or that the pre-test and post-test responsesremained the same and were positive toward alcohol use.<strong>Jackson</strong> <strong>County</strong> GRAA <strong>Evaluation</strong> <strong>Report</strong> 7