Development of hot-melt extrusion as a novel technique for the ...
Development of hot-melt extrusion as a novel technique for the ...
Development of hot-melt extrusion as a novel technique for the ...

You also want an ePaper? Increase the reach of your titles
YUMPU automatically turns print PDFs into web optimized ePapers that Google loves.
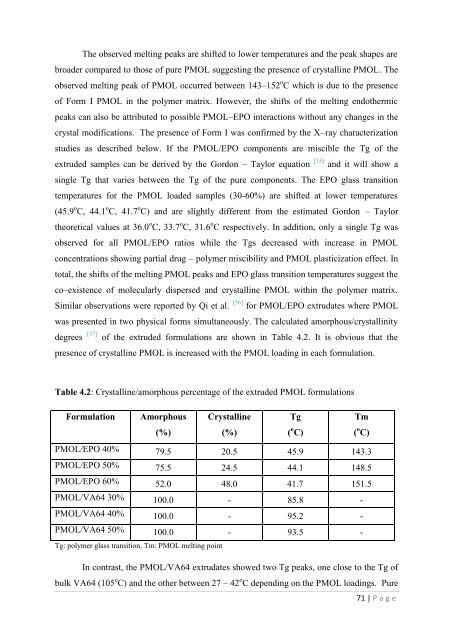
The observed <strong>melt</strong>ing peaks are shifted to lower temperatures and <strong>the</strong> peak shapes arebroader compared to those <strong>of</strong> pure PMOL suggesting <strong>the</strong> presence <strong>of</strong> crystalline PMOL. Theobserved <strong>melt</strong>ing peak <strong>of</strong> PMOL occurred between 143–152 o C which is due to <strong>the</strong> presence<strong>of</strong> Form I PMOL in <strong>the</strong> polymer matrix. However, <strong>the</strong> shifts <strong>of</strong> <strong>the</strong> <strong>melt</strong>ing endo<strong>the</strong>rmicpeaks can also be attributed to possible PMOL–EPO interactions without any changes in <strong>the</strong>crystal modifications. The presence <strong>of</strong> Form I w<strong>as</strong> confirmed by <strong>the</strong> X–ray characterizationstudies <strong>as</strong> described below. If <strong>the</strong> PMOL/EPO components are miscible <strong>the</strong> Tg <strong>of</strong> <strong>the</strong>extruded samples can be derived by <strong>the</strong> Gordon – Taylor equation [35] and it will show <strong>as</strong>ingle Tg that varies between <strong>the</strong> Tg <strong>of</strong> <strong>the</strong> pure components. The EPO gl<strong>as</strong>s transitiontemperatures <strong>for</strong> <strong>the</strong> PMOL loaded samples (30-60%) are shifted at lower temperatures(45.9 o C, 44.1 o C, 41.7 o C) and are slightly different from <strong>the</strong> estimated Gordon – Taylor<strong>the</strong>oretical values at 36.0 o C, 33.7 o C, 31.6 o C respectively. In addition, only a single Tg w<strong>as</strong>observed <strong>for</strong> all PMOL/EPO ratios while <strong>the</strong> Tgs decre<strong>as</strong>ed with incre<strong>as</strong>e in PMOLconcentrations showing partial drug – polymer miscibility and PMOL pl<strong>as</strong>ticization effect. Intotal, <strong>the</strong> shifts <strong>of</strong> <strong>the</strong> <strong>melt</strong>ing PMOL peaks and EPO gl<strong>as</strong>s transition temperatures suggest <strong>the</strong>co–existence <strong>of</strong> molecularly dispersed and crystalline PMOL within <strong>the</strong> polymer matrix.Similar observations were reported by Qi et al. [36] <strong>for</strong> PMOL/EPO extrudates where PMOLw<strong>as</strong> presented in two physical <strong>for</strong>ms simultaneously. The calculated amorphous/crystallinitydegrees [37] <strong>of</strong> <strong>the</strong> extruded <strong>for</strong>mulations are shown in Table 4.2. It is obvious that <strong>the</strong>presence <strong>of</strong> crystalline PMOL is incre<strong>as</strong>ed with <strong>the</strong> PMOL loading in each <strong>for</strong>mulation.Table 4.2: Crystalline/amorphous percentage <strong>of</strong> <strong>the</strong> extruded PMOL <strong>for</strong>mulationsFormulationAmorphousCrystallineTgTm(%)(%)( o C)( o C)PMOL/EPO 40% 79.5 20.5 45.9 143.3PMOL/EPO 50% 75.5 24.5 44.1 148.5PMOL/EPO 60% 52.0 48.0 41.7 151.5PMOL/VA64 30% 100.0 - 85.8 -PMOL/VA64 40% 100.0 - 95.2 -PMOL/VA64 50% 100.0 - 93.5 -Tg: polymer gl<strong>as</strong>s transition, Tm: PMOL <strong>melt</strong>ing pointIn contr<strong>as</strong>t, <strong>the</strong> PMOL/VA64 extrudates showed two Tg peaks, one close to <strong>the</strong> Tg <strong>of</strong>bulk VA64 (105 o C) and <strong>the</strong> o<strong>the</strong>r between 27 – 42 o C depending on <strong>the</strong> PMOL loadings. Pure71 | P a g e