- Page 3 and 4: DECLARATION“I certify that this w
- Page 6 and 7: taste masking effect of the process
- Page 8 and 9: CHAPTER 2: DISSOLUTION ENHANCEMENT
- Page 10 and 11: 3.2 Powder and ODT characterization
- Page 12 and 13: 3.7 In vitro drug release profiles
- Page 15: 3.1 Solubility parameters and extru
- Page 18 and 19: polymers.7.2 DSC findings of all AP
- Page 20 and 21: 2.4b Diffractograms of FMT formulat
- Page 22 and 23: 4.3 Schematic representation of the
- Page 24 and 25: 55 exrudates (b) DPD/L100-55 PM (c)
- Page 26 and 27: 8.5d A plot of the logarithm of HCS
- Page 28 and 29: L100Eudragit L100L100-55 Eudragit L
- Page 30 and 31: Maniruzzaman M, Rai D, Boateng JS.
- Page 32 and 33: Maniruzzaman M, Boateng JS, Bonnefi
- Page 34 and 35: CHAPTER 1: INTRODUCTION1.0 Backgrou
- Page 36 and 37: Table 1.1: HME and other convention
- Page 38 and 39: homogenize but also compress the ex
- Page 40 and 41: properties of polymers and excipien
- Page 42 and 43: particles‘ wettability [46] . A v
- Page 44 and 45: Table 1.2: Different hot-melt extru
- Page 46 and 47: 1.8 Aims and objectivesThe purpose
- Page 48 and 49: 29. Zheng X, Yang R, Tang X and Zhe
- Page 50 and 51: 56. International Conference on Har
- Page 52 and 53: CHAPTER 2: DISSOLUTION ENHANCEMENT
- Page 56 and 57: used. Each sample was scanned from
- Page 58 and 59: Furthermore, by means of thermodyna
- Page 60 and 61: 3.2 Particle size morphology and pa
- Page 62 and 63: Fig. 2.4a: Diffractograms of INM fo
- Page 64 and 65: However, the DSC thermograms of the
- Page 66 and 67: Fig. 2.5b: DSC thermograms of INM a
- Page 68 and 69: Fig. 2.5e: DSC thermograms of FMT a
- Page 70 and 71: Nevertheless, more than 80% FMT was
- Page 72 and 73: 6. Caron V, Tajber L, Corrigan OI,
- Page 74 and 75: CHAPTER 3: DEVELOPMENT AND EVALUATI
- Page 76 and 77: 2.2 Hot-Melt extrusionHot-melt extr
- Page 78 and 79: Committee of the University of Gree
- Page 80 and 81: The PM of formulation II (40% IBU)
- Page 82 and 83: Fig. 3.3: DSC thermograms of pure I
- Page 84 and 85: As a general rule, the powder compr
- Page 86 and 87: Fig. 3.4: Schematic diagram of ODT
- Page 88 and 89: Fig. 3.5: Schematic diagram of ODTs
- Page 90 and 91: Fig. 3.7: Schematic diagram of ODTs
- Page 92 and 93: F2 0 0.5 0 1 0 1F6 0 0.5 0 1 0 2F7
- Page 94 and 95: 6. M.F. Al-Omran, S.A. Al-Suwayeh,
- Page 96 and 97: 30. L. Saerens, L. Dierickx, B. Len
- Page 98 and 99: leading to significant variations w
- Page 100 and 101: 2.6. In vitro drug release studiesI
- Page 102 and 103: v2d 2p(4.1)Table 4.1: Calculated so
- Page 104 and 105:
The observed melting peaks are shif
- Page 106 and 107:
Fig. 4.2a: Powder XRPD patterns of
- Page 108 and 109:
Interestingly, no difference was ob
- Page 110 and 111:
7 Astree sensors Taste masking effi
- Page 112 and 113:
The in vitro e-tongue evaluation wa
- Page 114 and 115:
3. K. Woertz, C. Tissen, P. Kleineb
- Page 116 and 117:
25. B.C. Hancock, P. York, R.C. Row
- Page 118 and 119:
CHAPTER 5: AN IN VIVO AND IN VITRO
- Page 120 and 121:
(dispersion forces and polarization
- Page 122 and 123:
Table 5.1: Sample preparation for t
- Page 124 and 125:
Table 5.2: Solubility parameters ca
- Page 126 and 127:
Physical mixtures (PM) and extruded
- Page 128 and 129:
Fig. 5.2c: Thermograms of CTZ and V
- Page 130 and 131:
masking effect for active concentra
- Page 132 and 133:
Fig. 5.5b: Distance and discriminat
- Page 134 and 135:
Table 5.4: Mean standard deviation
- Page 136 and 137:
Fig. 5.6b: Release profiles of VRP
- Page 138 and 139:
17. Woertz K,Tissen C, Kleinebudde
- Page 140 and 141:
scale or lower. XPS is more accurat
- Page 142 and 143:
patterns were identified after ener
- Page 144 and 145:
3.3 Differential scanning calorimet
- Page 146 and 147:
Fig. 6.3a: Diffractograms of PRP fo
- Page 148 and 149:
good agreement with the anticipated
- Page 150 and 151:
Since L100 contained higher proport
- Page 152 and 153:
at ~533.01 eV is the combination of
- Page 154 and 155:
Finally, the XPS analysis confirmed
- Page 156 and 157:
Fig. 6.6b: 1 H NMR spectra of all P
- Page 158 and 159:
6) Bonferoni, M.C.; Rossi, S.; Ferr
- Page 160 and 161:
26) Vandencasteele, N.; Reniers, F.
- Page 162 and 163:
Gibbs free energy change before and
- Page 164 and 165:
2.5 Hot-melt extrusion (HME) proces
- Page 166 and 167:
2.11 X-ray photoelectron spectrosco
- Page 168 and 169:
Table 7.2: DSC findings of all APIs
- Page 170 and 171:
3.4 In vivo and in vitro taste mask
- Page 172 and 173:
Fig. 7.3c: Normalised DI (%) of all
- Page 174 and 175:
Table 7.4: Binding energy calculati
- Page 176 and 177:
PRP/ polymers extruded in compariso
- Page 178 and 179:
atom as NH + 4 . This observed N 1s
- Page 180 and 181:
8.0 ConclusionsThe presence of inte
- Page 182 and 183:
20. Davies MC, Wilding IR, Short RD
- Page 184 and 185:
CHAPTER 8: SUSTAINED RELEASE HYDROC
- Page 186 and 187:
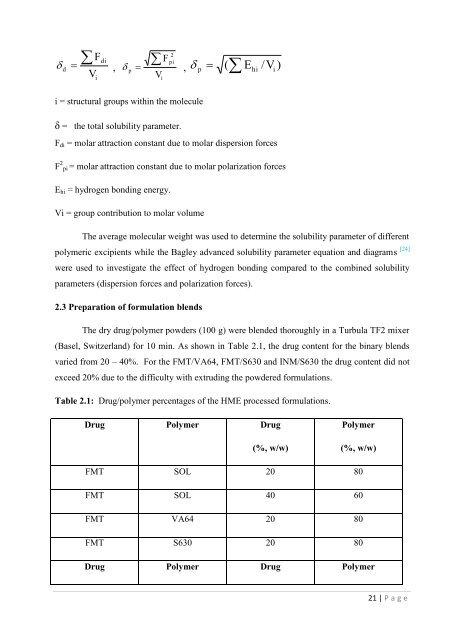
2.3 Preparation of formulation blen
- Page 188 and 189:
medium pH was maintained as 1.2 by
- Page 190 and 191:
Fig. 8.1: SEM images of [(a), (b)]
- Page 192 and 193:
Fig. 8.2b: DSC transitions of HCS/E
- Page 194 and 195:
in the range of 10-12 kP. However,
- Page 196 and 197:
ate and time on the basis of Eq. (8
- Page 198 and 199:
Fig. 8.5c: A plot of the cubic root
- Page 200 and 201:
when n > 0.89. From the results of
- Page 202 and 203:
14. Lam PL, Lee KKH,Wong RSM, Cheng
- Page 204 and 205:
Furthermore, HME has successfully b
- Page 206 and 207:
Supp. Fig. 2: XPS O 1s peaks for PR
- Page 208 and 209:
Supp. Fig. 4: O 1s BE peaks for L10
- Page 210 and 211:
8.2 s 6.2 s 3.8 s 1.8 s 200 msS
- Page 212 and 213:
12.2 s 9.0 s 6.2 s 3.8 s 1.8 s
- Page 214 and 215:
Supplementary table 1: Solubility p
- Page 216 and 217:
N = 55000/ 219.2 = 250.912Density:
- Page 218 and 219:
(4) Eudragit L100, N = (125000/202