Fig. 3.3: DSC <strong>the</strong>rmograms <strong>of</strong> pure IBU, physical IBU/EPO mixture and extruded IBU/EPOgranules, respectively.The IBU/EPO interactions and <strong>the</strong> existence <strong>of</strong> molecularly dispersed IBU have beenconfirmed by FTIR studies elsewhere [31] . The FT-IR findings elucidated a possible t<strong>as</strong>tem<strong>as</strong>king mechanism attributed to <strong>the</strong> intermolecular ionic interactions between <strong>the</strong> IBU‘sfunctional carboxylic and <strong>the</strong> EPO‘s dimethylamino groups. IBU can act <strong>as</strong> a hydrogen donorwith <strong>the</strong> hydrogen bonding acceptor dimethylamino group. The deprotonation <strong>of</strong> <strong>the</strong> -COOHfacilitates <strong>the</strong> <strong>for</strong>mation <strong>of</strong> a carboxylate salt and consequently builds a t<strong>as</strong>te m<strong>as</strong>king effect on<strong>the</strong> molecularly dispersed IBU.3.2 Powder and ODTs characterizationThe IBU/EPO extrudates (40% loading) were blended with five different superdisintegrantsat concentrations varying from 2-20% (w/w) <strong>as</strong> shown in Table 3.1 prior to tablet compaction.All batches were characterized in terms <strong>of</strong> compressibility by Carr‘s index determination. Theexcellent batch flowability and compressibility properties were attributed to <strong>the</strong> presence <strong>of</strong>microcrystalline cellulose, MCC, (Avicel 102), which is an excellent filler/flow-aid <strong>for</strong> directcompression with an average particle size <strong>of</strong> 90 µm. The addition <strong>of</strong> mannitol (Pearlitol C160)contributed <strong>as</strong> well to <strong>the</strong> improved tablet compressibility.49 | P a g e
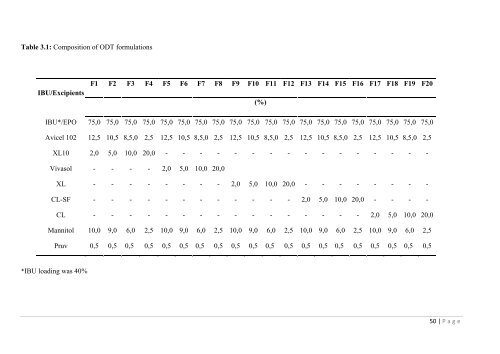
Table 3.1: Composition <strong>of</strong> ODT <strong>for</strong>mulationsIBU/ExcipientsF1 F2 F3 F4 F5 F6 F7 F8 F9 F10 F11 F12 F13 F14 F15 F16 F17 F18 F19 F20(%)IBU*/EPO 75,0 75,0 75,0 75,0 75,0 75,0 75,0 75,0 75,0 75,0 75,0 75,0 75,0 75,0 75,0 75,0 75,0 75,0 75,0 75,0Avicel 102 12,5 10,5 8,5,0 2,5 12,5 10,5 8,5,0 2,5 12,5 10,5 8,5,0 2,5 12,5 10,5 8,5,0 2,5 12,5 10,5 8,5,0 2,5XL10 2,0 5,0 10,0 20,0 - - - - - - - - - - - - - - - -Viv<strong>as</strong>ol - - - - 2,0 5,0 10,0 20,0XL - - - - - - - - 2,0 5,0 10,0 20,0 - - - - - - - -CL-SF - - - - - - - - - - - - 2,0 5,0 10,0 20,0 - - - -CL - - - - - - - - - - - - - - - - 2,0 5,0 10,0 20,0Mannitol 10,0 9,0 6,0 2,5 10,0 9,0 6,0 2,5 10,0 9,0 6,0 2,5 10,0 9,0 6,0 2,5 10,0 9,0 6,0 2,5Pruv 0,5 0,5 0,5 0,5 0,5 0,5 0,5 0,5 0,5 0,5 0,5 0,5 0,5 0,5 0,5 0,5 0,5 0,5 0,5 0,5*IBU loading w<strong>as</strong> 40%50 | P a g e
- Page 3 and 4:
DECLARATION“I certify that this w
- Page 6 and 7:
taste masking effect of the process
- Page 8 and 9:
CHAPTER 2: DISSOLUTION ENHANCEMENT
- Page 10 and 11:
3.2 Powder and ODT characterization
- Page 12 and 13:
3.7 In vitro drug release profiles
- Page 15:
3.1 Solubility parameters and extru
- Page 18 and 19:
polymers.7.2 DSC findings of all AP
- Page 20 and 21:
2.4b Diffractograms of FMT formulat
- Page 22 and 23:
4.3 Schematic representation of the
- Page 24 and 25:
55 exrudates (b) DPD/L100-55 PM (c)
- Page 26 and 27:
8.5d A plot of the logarithm of HCS
- Page 28 and 29:
L100Eudragit L100L100-55 Eudragit L
- Page 30 and 31:
Maniruzzaman M, Rai D, Boateng JS.
- Page 32 and 33: Maniruzzaman M, Boateng JS, Bonnefi
- Page 34 and 35: CHAPTER 1: INTRODUCTION1.0 Backgrou
- Page 36 and 37: Table 1.1: HME and other convention
- Page 38 and 39: homogenize but also compress the ex
- Page 40 and 41: properties of polymers and excipien
- Page 42 and 43: particles‘ wettability [46] . A v
- Page 44 and 45: Table 1.2: Different hot-melt extru
- Page 46 and 47: 1.8 Aims and objectivesThe purpose
- Page 48 and 49: 29. Zheng X, Yang R, Tang X and Zhe
- Page 50 and 51: 56. International Conference on Har
- Page 52 and 53: CHAPTER 2: DISSOLUTION ENHANCEMENT
- Page 54 and 55: Fdid ,Vi F2pip , p( Ehi/ ViVi )i =
- Page 56 and 57: used. Each sample was scanned from
- Page 58 and 59: Furthermore, by means of thermodyna
- Page 60 and 61: 3.2 Particle size morphology and pa
- Page 62 and 63: Fig. 2.4a: Diffractograms of INM fo
- Page 64 and 65: However, the DSC thermograms of the
- Page 66 and 67: Fig. 2.5b: DSC thermograms of INM a
- Page 68 and 69: Fig. 2.5e: DSC thermograms of FMT a
- Page 70 and 71: Nevertheless, more than 80% FMT was
- Page 72 and 73: 6. Caron V, Tajber L, Corrigan OI,
- Page 74 and 75: CHAPTER 3: DEVELOPMENT AND EVALUATI
- Page 76 and 77: 2.2 Hot-Melt extrusionHot-melt extr
- Page 78 and 79: Committee of the University of Gree
- Page 80 and 81: The PM of formulation II (40% IBU)
- Page 84 and 85: As a general rule, the powder compr
- Page 86 and 87: Fig. 3.4: Schematic diagram of ODT
- Page 88 and 89: Fig. 3.5: Schematic diagram of ODTs
- Page 90 and 91: Fig. 3.7: Schematic diagram of ODTs
- Page 92 and 93: F2 0 0.5 0 1 0 1F6 0 0.5 0 1 0 2F7
- Page 94 and 95: 6. M.F. Al-Omran, S.A. Al-Suwayeh,
- Page 96 and 97: 30. L. Saerens, L. Dierickx, B. Len
- Page 98 and 99: leading to significant variations w
- Page 100 and 101: 2.6. In vitro drug release studiesI
- Page 102 and 103: v2d 2p(4.1)Table 4.1: Calculated so
- Page 104 and 105: The observed melting peaks are shif
- Page 106 and 107: Fig. 4.2a: Powder XRPD patterns of
- Page 108 and 109: Interestingly, no difference was ob
- Page 110 and 111: 7 Astree sensors Taste masking effi
- Page 112 and 113: The in vitro e-tongue evaluation wa
- Page 114 and 115: 3. K. Woertz, C. Tissen, P. Kleineb
- Page 116 and 117: 25. B.C. Hancock, P. York, R.C. Row
- Page 118 and 119: CHAPTER 5: AN IN VIVO AND IN VITRO
- Page 120 and 121: (dispersion forces and polarization
- Page 122 and 123: Table 5.1: Sample preparation for t
- Page 124 and 125: Table 5.2: Solubility parameters ca
- Page 126 and 127: Physical mixtures (PM) and extruded
- Page 128 and 129: Fig. 5.2c: Thermograms of CTZ and V
- Page 130 and 131: masking effect for active concentra
- Page 132 and 133:
Fig. 5.5b: Distance and discriminat
- Page 134 and 135:
Table 5.4: Mean standard deviation
- Page 136 and 137:
Fig. 5.6b: Release profiles of VRP
- Page 138 and 139:
17. Woertz K,Tissen C, Kleinebudde
- Page 140 and 141:
scale or lower. XPS is more accurat
- Page 142 and 143:
patterns were identified after ener
- Page 144 and 145:
3.3 Differential scanning calorimet
- Page 146 and 147:
Fig. 6.3a: Diffractograms of PRP fo
- Page 148 and 149:
good agreement with the anticipated
- Page 150 and 151:
Since L100 contained higher proport
- Page 152 and 153:
at ~533.01 eV is the combination of
- Page 154 and 155:
Finally, the XPS analysis confirmed
- Page 156 and 157:
Fig. 6.6b: 1 H NMR spectra of all P
- Page 158 and 159:
6) Bonferoni, M.C.; Rossi, S.; Ferr
- Page 160 and 161:
26) Vandencasteele, N.; Reniers, F.
- Page 162 and 163:
Gibbs free energy change before and
- Page 164 and 165:
2.5 Hot-melt extrusion (HME) proces
- Page 166 and 167:
2.11 X-ray photoelectron spectrosco
- Page 168 and 169:
Table 7.2: DSC findings of all APIs
- Page 170 and 171:
3.4 In vivo and in vitro taste mask
- Page 172 and 173:
Fig. 7.3c: Normalised DI (%) of all
- Page 174 and 175:
Table 7.4: Binding energy calculati
- Page 176 and 177:
PRP/ polymers extruded in compariso
- Page 178 and 179:
atom as NH + 4 . This observed N 1s
- Page 180 and 181:
8.0 ConclusionsThe presence of inte
- Page 182 and 183:
20. Davies MC, Wilding IR, Short RD
- Page 184 and 185:
CHAPTER 8: SUSTAINED RELEASE HYDROC
- Page 186 and 187:
2.3 Preparation of formulation blen
- Page 188 and 189:
medium pH was maintained as 1.2 by
- Page 190 and 191:
Fig. 8.1: SEM images of [(a), (b)]
- Page 192 and 193:
Fig. 8.2b: DSC transitions of HCS/E
- Page 194 and 195:
in the range of 10-12 kP. However,
- Page 196 and 197:
ate and time on the basis of Eq. (8
- Page 198 and 199:
Fig. 8.5c: A plot of the cubic root
- Page 200 and 201:
when n > 0.89. From the results of
- Page 202 and 203:
14. Lam PL, Lee KKH,Wong RSM, Cheng
- Page 204 and 205:
Furthermore, HME has successfully b
- Page 206 and 207:
Supp. Fig. 2: XPS O 1s peaks for PR
- Page 208 and 209:
Supp. Fig. 4: O 1s BE peaks for L10
- Page 210 and 211:
8.2 s 6.2 s 3.8 s 1.8 s 200 msS
- Page 212 and 213:
12.2 s 9.0 s 6.2 s 3.8 s 1.8 s
- Page 214 and 215:
Supplementary table 1: Solubility p
- Page 216 and 217:
N = 55000/ 219.2 = 250.912Density:
- Page 218 and 219:
(4) Eudragit L100, N = (125000/202