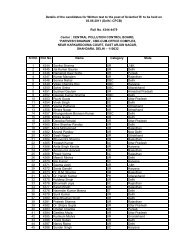
- Page 1:
Monitoring of Indiann National Aqua
- Page 4 and 5:
CONTENTSExecutive SummaryPageI-XIII
- Page 6 and 7:
9.1 Narmada River System9.2 Water Q
- Page 8 and 9:
PageChapter XIX Water Quality of La
- Page 10 and 11:
(E), Varuna, Sai, Gomti, Rapti, Sar
- Page 12:
Purna, Kanhan, Wena, Darna, Nira, P
- Page 16 and 17:
Tapi 10.0 16.0 Decreasing Vel 14.0
- Page 18 and 19:
KeralaOrissaJanunia Talab inMadhya
- Page 20 and 21:
Imphal, Kallai, Puzhackal, Venna &W
- Page 22 and 23:
CHAPTER 1WATER AVAILABILITY, POLLUT
- Page 24 and 25:
1.1.2 Industrial RequirementAnother
- Page 26 and 27:
Population Stress and water insecur
- Page 28 and 29:
industrial establishments and runof
- Page 30 and 31:
for different uses have been identi
- Page 32 and 33:
CHAPTER-IIWATER QUALITY MONITORING
- Page 34 and 35:
Table-2.2 List of Parametersunder N
- Page 36 and 37:
2.4 State/UnionTerritory (UT) Level
- Page 38 and 39:
PUNJAB(TOTAL‐69)•RIVERS :38•L
- Page 40 and 41:
BOD, FC and TC whereas DO, pH and C
- Page 42 and 43:
whereas Conductivity, Nitrate, FC a
- Page 44 and 45:
environment. Water Quality (ground
- Page 46 and 47:
Conductivity, TC and FC is confirmi
- Page 48 and 49:
Table 2.5: SURFACE WATER- Percent V
- Page 50 and 51:
Table 2.7: RIVERS- Percent Violatio
- Page 52 and 53:
Table 2.9: PONDS- Percent Violation
- Page 54 and 55:
Figure 2: Water Quality Trend (BOD,
- Page 56 and 57:
Figure 3.3: Water Quality Trend of
- Page 58 and 59:
Figure 3.9: Water Quality Trend of
- Page 60 and 61:
Figure 3.15: Water Quality Trend of
- Page 62 and 63:
Table 3.1: Water Quality in Indian
- Page 64 and 65:
Name of theRiverLength (Km)No of Mo
- Page 66 and 67:
Name of theRiverLength (Km)No of Mo
- Page 68 and 69:
Name of theRiverLength (Km)No of Mo
- Page 70 and 71:
4.1 Indus River SystemCHAPTER IVWat
- Page 72 and 73:
FECAL COLIFORM (MPN/100ml)100001000
- Page 74 and 75:
Figure 4.3: Water Quality of River
- Page 76 and 77:
5.1 Ganga River SystemCHAPTER VWate
- Page 78 and 79:
12WATER QUALITY OF RIVER GANGA IN U
- Page 80 and 81:
FAECAL COLIFORM(MPN/100ml)100000100
- Page 82 and 83:
TOTAL COLIFORM (MPN/100ml)100000010
- Page 84 and 85: CONDUCTIVITY (µmhos/cm)1000100101W
- Page 86 and 87: Figure 5.6: Water Quality of River
- Page 88 and 89: The availability of water in River
- Page 90 and 91: The low value of DO (0.0 mg/l) is o
- Page 92 and 93: CONDUCTIVITY (µmhos/cm)10000100010
- Page 94 and 95: Burhi Gandak, Harbora, Kamla, Manus
- Page 96 and 97: The Faecal Coliform value ranges fr
- Page 98 and 99: CHAPTER VIWater Quality of Rivers i
- Page 100 and 101: TOTAL COLIFORM(MPN/100ml)1000001000
- Page 102 and 103: CHAPTER VII7.1 Mahi River SystemWat
- Page 104 and 105: TOTAL COLIFORM(MPN/100ml)100WATER Q
- Page 106 and 107: 8.2 Water Quality Monitoring in Sab
- Page 108 and 109: presented as minimum, maximum and m
- Page 110 and 111: CHAPTER X10.1 Tapi River SystemWate
- Page 112 and 113: The water quality of other tributar
- Page 114 and 115: CHAPTER XIWater Quality of Rivers i
- Page 116 and 117: Conductivity, BOD, Nitrate +Nitrite
- Page 118 and 119: 100000WATER QUALITY OF RIVER MAHANA
- Page 120 and 121: 100000WATER QUALITY OF RIVERR MAHAN
- Page 122 and 123: CHAPTER XIIWater Quality of Rivers
- Page 124 and 125: Figure 12.1: Water Quality of River
- Page 126 and 127: 12.4 Water Quality of River Baitarn
- Page 128 and 129: CHAPTER XIIIWater Quality of Rivers
- Page 130 and 131: B.O.D. (mg/l)8.0WATER QUALITY OF RI
- Page 132 and 133: CHAPTER XIVWater Quality of Rivers
- Page 136 and 137: Figure 14.3: Water Quality of River
- Page 138 and 139: 14.2.2 Water Quality of tributary s
- Page 140 and 141: 15.2 Water Quality Monitoring in Kr
- Page 142 and 143: Figure 15.2: Water Quality of River
- Page 144 and 145: in Andhra Pradesh and Karnataka ind
- Page 146 and 147: CHAPTER XVIWater Quality of Rivers
- Page 148 and 149: CHAPTER XVIIWater Quality of Rivers
- Page 150 and 151: WATER QUALITY OF RIVER CAUVERY IN K
- Page 152 and 153: CONDUCTIVITY (µmhos/cm)10000100010
- Page 154 and 155: mentioned rivers in Goa is meeting
- Page 156 and 157: water bodies. The Total and Faecal
- Page 158 and 159: Figure 18.1: Water Quality of River
- Page 160 and 161: 18.7 Water Quality of Medium and Mi
- Page 162 and 163: The Total and Faecal Coliform does
- Page 164 and 165: Sirpur Talav (1), Sohna Lake (1), S
- Page 166 and 167: varies from 0.0 to 82.0 mg/l wherea
- Page 168 and 169: Narayan Bari (3.8 mg/l) & Rudrasaga
- Page 170 and 171: The ranges of water quality observe
- Page 172 and 173: 20.10 Status of Ground Water Qualit
- Page 174 and 175: Punyata (2820 µmhos/cm); village B
- Page 176 and 177: TABLE 4.1 :- WATER QUALITY OF RIVER
- Page 178 and 179: iaxeaiaxeaiaxSTATIONCODEeaiaxeaiaxe
- Page 180 and 181: WATER QUALITY CRITERIA > 4 mg/l 6.5
- Page 182 and 183: 1231 MAHI AT VIRPUR GUJARAT 22.0 28
- Page 184 and 185:
1301241224081640AFTER CONFL. OF GAN
- Page 186 and 187:
GODAVARI AT RAJAMUNDRY U/S OF2370AN
- Page 188 and 189:
TABLE 15.3 :- WATER QUALITY OF TRIB
- Page 190 and 191:
31 CAUVERY AT MUSIRI TAMILNADUCAUVE
- Page 192 and 193:
26761151146226852686268726882689MUC
- Page 194 and 195:
TABLE 18.4 :- WATER QUALITY OF MEDI
- Page 196 and 197:
ROAD), DISTT. IMPHAL WEST 0 0 5NAMB
- Page 198 and 199:
YAMUNA156.1502 CIVIL MILL DRAIN, DE
- Page 200 and 201:
UDAIPUR, PT NO. 1 0 0 5LAKE JAISAMA
- Page 202 and 203:
MAINH GHAT ON DUDHPUKUR AT20.2504WE
- Page 204 and 205:
AT KALA AMB, H.PHIMACHAL PRADESH25.
- Page 206 and 207:
VILLAGE BHIMPORE,DAMANDAMAN29.0.602
- Page 208 and 209:
208820892090209120922093BORE WELL O
- Page 210 and 211:
NEAR ARYA KANYA INTER COLLEGE.16.20
- Page 212:
BURDWAN, WEST BENGAL 5 3 1DURGAPUR