- Page 1:
Monitoring of Indiann National Aqua
- Page 4 and 5:
CONTENTSExecutive SummaryPageI-XIII
- Page 6 and 7:
9.1 Narmada River System9.2 Water Q
- Page 8 and 9:
PageChapter XIX Water Quality of La
- Page 10 and 11: (E), Varuna, Sai, Gomti, Rapti, Sar
- Page 12: Purna, Kanhan, Wena, Darna, Nira, P
- Page 16 and 17: Tapi 10.0 16.0 Decreasing Vel 14.0
- Page 18 and 19: KeralaOrissaJanunia Talab inMadhya
- Page 20 and 21: Imphal, Kallai, Puzhackal, Venna &W
- Page 22 and 23: CHAPTER 1WATER AVAILABILITY, POLLUT
- Page 24 and 25: 1.1.2 Industrial RequirementAnother
- Page 26 and 27: Population Stress and water insecur
- Page 28 and 29: industrial establishments and runof
- Page 30 and 31: for different uses have been identi
- Page 32 and 33: CHAPTER-IIWATER QUALITY MONITORING
- Page 34 and 35: Table-2.2 List of Parametersunder N
- Page 36 and 37: 2.4 State/UnionTerritory (UT) Level
- Page 38 and 39: PUNJAB(TOTAL‐69)•RIVERS :38•L
- Page 40 and 41: BOD, FC and TC whereas DO, pH and C
- Page 42 and 43: whereas Conductivity, Nitrate, FC a
- Page 44 and 45: environment. Water Quality (ground
- Page 46 and 47: Conductivity, TC and FC is confirmi
- Page 48 and 49: Table 2.5: SURFACE WATER- Percent V
- Page 50 and 51: Table 2.7: RIVERS- Percent Violatio
- Page 52 and 53: Table 2.9: PONDS- Percent Violation
- Page 54 and 55: Figure 2: Water Quality Trend (BOD,
- Page 56 and 57: Figure 3.3: Water Quality Trend of
- Page 58 and 59: Figure 3.9: Water Quality Trend of
- Page 62 and 63: Table 3.1: Water Quality in Indian
- Page 64 and 65: Name of theRiverLength (Km)No of Mo
- Page 66 and 67: Name of theRiverLength (Km)No of Mo
- Page 68 and 69: Name of theRiverLength (Km)No of Mo
- Page 70 and 71: 4.1 Indus River SystemCHAPTER IVWat
- Page 72 and 73: FECAL COLIFORM (MPN/100ml)100001000
- Page 74 and 75: Figure 4.3: Water Quality of River
- Page 76 and 77: 5.1 Ganga River SystemCHAPTER VWate
- Page 78 and 79: 12WATER QUALITY OF RIVER GANGA IN U
- Page 80 and 81: FAECAL COLIFORM(MPN/100ml)100000100
- Page 82 and 83: TOTAL COLIFORM (MPN/100ml)100000010
- Page 84 and 85: CONDUCTIVITY (µmhos/cm)1000100101W
- Page 86 and 87: Figure 5.6: Water Quality of River
- Page 88 and 89: The availability of water in River
- Page 90 and 91: The low value of DO (0.0 mg/l) is o
- Page 92 and 93: CONDUCTIVITY (µmhos/cm)10000100010
- Page 94 and 95: Burhi Gandak, Harbora, Kamla, Manus
- Page 96 and 97: The Faecal Coliform value ranges fr
- Page 98 and 99: CHAPTER VIWater Quality of Rivers i
- Page 100 and 101: TOTAL COLIFORM(MPN/100ml)1000001000
- Page 102 and 103: CHAPTER VII7.1 Mahi River SystemWat
- Page 104 and 105: TOTAL COLIFORM(MPN/100ml)100WATER Q
- Page 106 and 107: 8.2 Water Quality Monitoring in Sab
- Page 108 and 109: presented as minimum, maximum and m
- Page 110 and 111:
CHAPTER X10.1 Tapi River SystemWate
- Page 112 and 113:
The water quality of other tributar
- Page 114 and 115:
CHAPTER XIWater Quality of Rivers i
- Page 116 and 117:
Conductivity, BOD, Nitrate +Nitrite
- Page 118 and 119:
100000WATER QUALITY OF RIVER MAHANA
- Page 120 and 121:
100000WATER QUALITY OF RIVERR MAHAN
- Page 122 and 123:
CHAPTER XIIWater Quality of Rivers
- Page 124 and 125:
Figure 12.1: Water Quality of River
- Page 126 and 127:
12.4 Water Quality of River Baitarn
- Page 128 and 129:
CHAPTER XIIIWater Quality of Rivers
- Page 130 and 131:
B.O.D. (mg/l)8.0WATER QUALITY OF RI
- Page 132 and 133:
CHAPTER XIVWater Quality of Rivers
- Page 135 and 136:
Figure 14.2: Water Quality of River
- Page 137 and 138:
Figure 14.4: Water Quality of River
- Page 139 and 140:
CHAPTER XVWater Quality of Rivers i
- Page 141 and 142:
Figure 15.1: Water Quality of River
- Page 143 and 144:
TOTAL COLIFORM (MPN/100ml)100001000
- Page 145 and 146:
BOD ranges from 1.4 to 23.5 mg/l in
- Page 147 and 148:
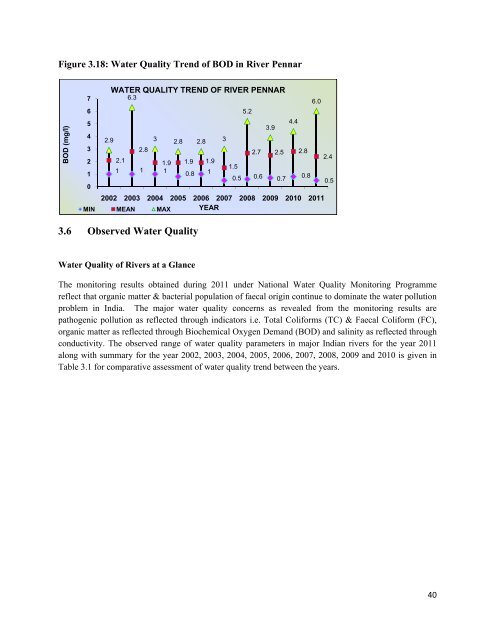
16.2.1 Water Quality ofRiver Penner
- Page 149 and 150:
WATER QUALITY OF RIVER CAUVERY INKA
- Page 151 and 152:
CONDUCTIVITY (µmhos/cm)10000100010
- Page 153 and 154:
CHAPTER XVIIIWater Quality of Mediu
- Page 155 and 156:
18.4 Water Quality of Medium and Mi
- Page 157 and 158:
The water quality monitoring of Riv
- Page 159 and 160:
Figure 18.2: Water Quality of River
- Page 161 and 162:
18.8.1 Water Quality of Creeks and
- Page 163 and 164:
19.1 Lantic Water BodiesCHAPTER XIX
- Page 165 and 166:
DO varies from 0.4 mg/l to 14.3 mg/
- Page 167 and 168:
(1.9 mg/l) & Surinsar Lake (2.2 mg/
- Page 169 and 170:
CHAPTER XXAssessment of Groundwater
- Page 171 and 172:
20.6 Status of Ground Water Quality
- Page 173 and 174:
Paithan (4.0 mg/ l), TPS Durgapur (
- Page 175 and 176:
varies from 356-1015 µmhos/cm and
- Page 177 and 178:
SIRSA AT D/S NALAGARH DISTT.HIMACHA
- Page 179 and 180:
KOSHI RIVER AT KURSHELA ATBIHAR2565
- Page 181 and 182:
POINT OF OIL INDIA LTD.)2065 PAGLDI
- Page 183 and 184:
TABLE 11.1 : - WATER QUALITY OF RIV
- Page 185 and 186:
TABLE 13.1 :- WATER QUALITY OF RIVE
- Page 187 and 188:
2723RLY BDG, HINGANGHAT 0 0 4WENA A
- Page 189 and 190:
MULA AT HARRISON BRIDGE NEAR2194MAH
- Page 191 and 192:
DAMANGANGA AT DAMAN JETTY, MOTI DAM
- Page 193 and 194:
2293 R KADALUNDI AT HAJIRAPPALLY KE
- Page 195 and 196:
0 0 8 8GHAGGAR AT U/S DHAKANSU NALL
- Page 197 and 198:
CHOUPATHY. 0 0 0 0 326. 29. 28.1928
- Page 199 and 200:
25. 26. 26.1579 ALAPPUZHA KERALA5.6
- Page 201 and 202:
BASKANDI POND INSIDE THE2225ASSAM 8
- Page 203 and 204:
22.283 286 285 2.7 3.4 3.051 5 3224
- Page 205 and 206:
WELL AT ELOOR, KERALAKERALA26.1924
- Page 207 and 208:
AKOT, AKOLA22. 7.82002MAHARASHTRA 2
- Page 209 and 210:
OPPOSITE PRIVATE BUS STAND,7.12030A
- Page 211 and 212:
1658NEAR RIVER KUSHABHADRA, PURI,OR