Recruitment and Retention in the Post-16 Learning and Skills Sector
Recruitment and Retention in the Post-16 Learning and Skills Sector
Recruitment and Retention in the Post-16 Learning and Skills Sector

You also want an ePaper? Increase the reach of your titles
YUMPU automatically turns print PDFs into web optimized ePapers that Google loves.
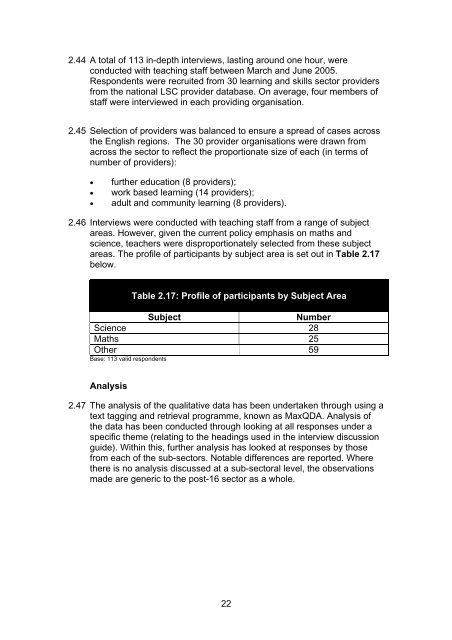
2.44 A total of 113 <strong>in</strong>-depth <strong>in</strong>terviews, last<strong>in</strong>g around one hour, wereconducted with teach<strong>in</strong>g staff between March <strong>and</strong> June 2005.Respondents were recruited from 30 learn<strong>in</strong>g <strong>and</strong> skills sector providersfrom <strong>the</strong> national LSC provider database. On average, four members ofstaff were <strong>in</strong>terviewed <strong>in</strong> each provid<strong>in</strong>g organisation.2.45 Selection of providers was balanced to ensure a spread of cases across<strong>the</strong> English regions. The 30 provider organisations were drawn fromacross <strong>the</strong> sector to reflect <strong>the</strong> proportionate size of each (<strong>in</strong> terms ofnumber of providers):• fur<strong>the</strong>r education (8 providers);• work based learn<strong>in</strong>g (14 providers);• adult <strong>and</strong> community learn<strong>in</strong>g (8 providers).2.46 Interviews were conducted with teach<strong>in</strong>g staff from a range of subjectareas. However, given <strong>the</strong> current policy emphasis on maths <strong>and</strong>science, teachers were disproportionately selected from <strong>the</strong>se subjectareas. The profile of participants by subject area is set out <strong>in</strong> Table 2.17below.Table 2.17: Profile of participants by Subject AreaSubjectNumberScience 28Maths 25O<strong>the</strong>r 59Base: 113 valid respondentsAnalysis2.47 The analysis of <strong>the</strong> qualitative data has been undertaken through us<strong>in</strong>g atext tagg<strong>in</strong>g <strong>and</strong> retrieval programme, known as MaxQDA. Analysis of<strong>the</strong> data has been conducted through look<strong>in</strong>g at all responses under aspecific <strong>the</strong>me (relat<strong>in</strong>g to <strong>the</strong> head<strong>in</strong>gs used <strong>in</strong> <strong>the</strong> <strong>in</strong>terview discussionguide). With<strong>in</strong> this, fur<strong>the</strong>r analysis has looked at responses by thosefrom each of <strong>the</strong> sub-sectors. Notable differences are reported. Where<strong>the</strong>re is no analysis discussed at a sub-sectoral level, <strong>the</strong> observationsmade are generic to <strong>the</strong> post-<strong>16</strong> sector as a whole.22