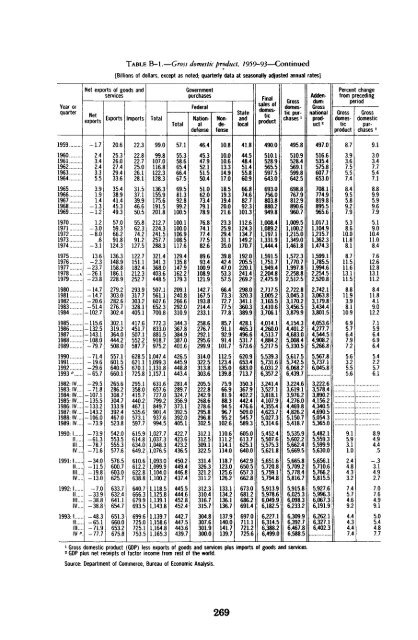
NATIONAL INCOME OR EXPENDITURETABLE B-l.—Gross domestic product, 1959-93[Billions <strong>of</strong> dollars, except as noted; quarterly data at seasonally adjusted annual rates]Year or quarterGrossdomesticproductPersonal consumption expendituresTotalDurablegoodsNondurablegoodsServicesGross private domestic investmentTotalFixed investmentTotalNonresidentialTotalStructuresProducers'durableequipmentResidentialChangeinbusinessinventories19591960196119621963196419651966196719681969197019711972197319741975197619771978197919801981198219831984198519861987198819891990199119921993 "1982: IV..1983: IV..1984: IV..1985: IV..1986: IV..1987: IV..1988: IV..1989: IV..1990:1 IIIV1991:1.IIIllIV1992:1 IIIllIV1993:1 IIIllIV "...494.2513.3531.8571.6603.1648.0702.7769.8814.3889.3959.51,010.71,097.21,207.01,349.61,458.61,585.91,768.41,974.12,232.72,488.62,708.03,030.63,149.63,405.03,777.24,038.74,268.64,539.94,900.45,250.85,546.15,722.96,038.56,374.03,195.13,547.33,869.14,140.54,336.64,683.05,044.65,344.85,461.95,540.95,583.85,597.95,631.75,697.75,758.65,803.75,908.75,991.46,059.56,194.46,261.66,327.66,395.96,510.8318.1332.4343.5364.4384.2412.5444.6481.6509.3559.1603.7646.5700.3767.8848.1927.71,024.91,143.11,271.51,421.21,583.71,748.11,926.22,059.22.257.52,460.32,667.42,850.63,052.23,296.13,523.13,761.23,906.44,139.94,390.62,128.72,346.82,526.42,739.82,923.13,124.63,398.23,599.13,679.33,727.03,801.73,836.63,843.63,887.83,929.83,964.14,046.54,099.94,157.14,256.24,296.24,359.94,419.14,487.442.843.541.947.051.856.863.568.570.681.086.285.397.2110.7124.1123.0134.3160.0182.6202.3214.2212.5228.5236.5275.0317.9352.9389.6403.7437.1459.4468.2457.8497.3537.7246.9297.7328.2354.4406.8408.8452.9458.3479.8466.0467.3459.5448.9452.0465.1465.2484.0487.8500.9516.6515.3531.6541.9561.9148.5153.1157.4163.8169.4179.7191.9208.5216.9235.0252.2270.4283.3305.2339.6380.8416.0451.8490.4541.5613.3682.9744.2772.3817.8873.0919.4952.21,011.11,073.81,149.51,229.21,257.91,300.91,350.2787.3839.8887.8939.5963.71,029.41,105.81,173.51,201.71,213.61,241.01,260.71,252.31,259.21,260.01,260.01,278.21,288.21,305.71,331.71,335.31,344.81,352.41,368.4126.8135.9144.1153.6163.1175.9189.2204.6221.7243.1265.3290.8319.8351.9384.5423.9474.5531.2598.4677.4756.2852.7953.51,050.41,164.71,269.41,395.11,508.81,637.41,785.21,914.22,063.82,190.72,341.62,502.71,094.61,209.31,310.41,446.01,552.61,686.41,839.51,967.31,997.82,047.52,093.42,116.42,142.42,176.62,204.82,239.02,284.42,323.82,350.52,407.92,445.52,483.42,524.82,557.278.878.777.987.993.4101.7118.0130.4128.0139.9155.2150.3175.5205.6243.1245.8226.0286.4358.3434.0480.2467.6558.0503.4546.7718.9714.5717.6749.3793.6832.3808.9736.9796.5892.0464.2614.8722.8737.0697.1800.2814.8825.2828.9837.8812.5756.4729.1721.5744.5752.4750.8799.7802.2833.3874.1874.1884.0935.874.675.575.081.887.796.7108.3116.7117.6130.8145.5148.1167.5195.7225.4231.5231.7269.6333.5406.1467.5477.1532.5519.3552.2647.8689.9709.0723.0777.4798.9802.0745.5789.1875.2510.5594.6671.8704.4715.9740.9797.5795.0819.3804.5804.1780.3749.0744.5745.0743.5755.9786.8792.5821.3839.5861.0876.3924.146.549.248.652.855.662.474.184.485.292.1102.9106.7111.7126.1150.0165.6169.0187.2223.2274.5326.4353.8410.0413.7400.2468.9504.0492.4497.8545.4568.1586.7555.9565.5622.9397.7426.9491.5511.3491.7514.3560.2568.8586.2582.1594.1584.4566.8561.0552.6543.3547.0566.3569.2579.5594.7619.1624.9653.018.119.619.720.821.223.728.331.331.533.637.740.342.747.255.061.261.465.974.693.9118.4137.5169.1178.8153.1175.6193.4174.0171.3182.0193.3201.6182.6172.6178.6168.9154.6184.1195.4168.4180.0186.8198.0203.6203.2203.8195.7192.2188.4178.0171.7173.9174.5170.8171.1172.4177.6179.1185.228.329.728.932.134.438.745.853.053.758.565.266.469.178.995.1104.3107.6121.2148.7180.6208.1216.4240.9234.9247.1293.3310.6318.4326.5363.4374.8385.1373.3392.9444.4228.8272.3307.3315.9323.3334.3373.4370.8382.5378.9390.3388.7374.6372.6374.6371.5373.1391.7398.4408.3422.2441.6445.8467.828.126.326.429.032.134.334.232.332.438.742.641.455.869.775.366.062.782.5110.3131.6141.0123.3122.5105.7152.0178.9185.9216.6225.2232.0230.9215.3189.6223.6252.3112.8167.7180.4193.1224.2226.5237.3226.2233.2222.4209.9195.8182.2183.6192.4200.3208.9220.6223.3241.8244.9241.9251.3271.14.23.22.96.15.75.09.713.810.59.19.72.38.09.917.714.3-5.716.724.727.912.8-9.525.4-15.9-5.571.124.68.626.316.233.36.9-8.67.316.8-46.320.251.032.6-18.859.317.330.29.633.38.4-23.9-19.9-23.0-.58.9-5.112.99.712.034.613.17.711.7See next page for continuation <strong>of</strong> table.268
TABLE B-l.—Gross domestic product. 1959-93—Continued[Billions <strong>of</strong> dollars, except as noted; quarterly data at seasonally adjusted annual rates]Year orquarter19591960196119621963196419651966196719681969197019711972197319741975197619771978 ,.197919801981198219831984198519861987198819891990199119921993 p1982: IV....1983: IV....1984: IV....1985: IV....1986: IV....1987: IV....1988: IV...1989: IV...1990: I II....III...IV...1991:1 II....III...IV...1992:1 II....III...IV...1993:1 II....III...IVNet exports <strong>of</strong> goods andservicesNetexports-1.72.43.42.43.35.53.91.91.4-1.3-1.21.2-3.0-8.0.6-3.113.6-2.3-23.7-26.1-23.8-14.7-14.7-20.6-51.4-102.7-115.6-132.5-143.1-108.0-79.7-71.4-19.6-29.6-65.7-29.5-71.8-107.1-135.5-133.2-143.2-106.0-73.9-73.9-61.3-78.7-71.6-34.0-11.5-19.8-13.0-7.0-33.9-38.8-38.8-48.3-65.1-71.9-77.7Exports20.625.326.027.429.433.635.438.941.445.349.357.059.366.291.8124.3136.3148.9158.8186.1228.9279.2303.0282.6276.7302.4302.1319.2364.0444.2508.0557.1601.5640.5660.1265.6286.2308.7304.7333.9392.4467.0523.8542.0553.5555.3577.6576.5600.7603.0625.7633.7632.4641.1654.7651.3660.0653.2675.8Imports22.322.822.725.026.128.131.537.139.946.650.555.862.374.291.2127.5122.7151.1182.4212.3252.7293.9317.7303.2328.1405.1417.6451.7507.1552.2587.7628.5621.1670.1725.8295.1358.0415.7440.2467.1535.6573.1597.7615.9614.8634.0649.2610.6612.2622.8638.8640.7666.3679.9693.5699.6725.0725.1753.5Total99.099.8107.0116.8122.3128.3136.3155.9175.6191.5201.8212.7224.3241.5257.7288.3321.4341.3368.0403.6448.5507.1561.1607.6652.3700.8772.3833.0881.5918.7975.21,047.41,099.31,131.81,157.1631.6657.6727.0799.2849.7901.4937.6994.51,027.71,037.31,048.31,076.51,093.01,099.91,104.01,100.21,118.51,125.81,139.11,143.81,139.71,158.61,164.81,165.3GovernmentpurchasesFederalTotal57.155.358.665.466.467.569.581.392.899.2100.5100.1100.0106.9108.5117.6129.4135.8147.9162.2179.3209.1240.8266.6292.0310.9344.3367.8384.9387.0401.6426.5445.9448.8443.4281.4289.7324.7356.9373.1392.5392.0405.1422.7423.6423.2436.5450.2449.4446.8437.4445.5444.6452.8452.4442.7447.5443.6439.7Nationaldefense46.445.347.952.151.550.451.062.073.479.178.976.874.177.477.582.689.693.4100.9108.9121.9142.7167.5193.8214.4233.1258.6276.7292.1295.6299.9314.0322.5313.8303.6205.5222.8242.9268.6278.6295.8296.8302.5312.1312.5309.1322.5331.4326.3321.2311.2312.3310.4316.7315.7304.8307.6301.9300.0Nondefense10.810.010.613.314.917.018.519.319.420.021.623.325.929.431.135.039.842.447.053.357.566.473.372.777.577.885.791.192.991.4101.7112.5123.4135.0139.875.966.981.988.394.596.795.2102.6110.6111.2114.1114.0118.7123.0125.6126.2133.1134.2136.1136.7137.9140.0141.7139.7Stateandlocal41.844.548.451.455.860.966.874.682.792.3101.3112.6124.3134.7149.2170.7192.0205.5220.1241.4269.2298.0320.3341.1360.3389.9428.1465.3496.6531.7573.6620.9653.4683.0713.7350.3367.9402.2442.4476.6509.0545.7589.3605.0613.7625.1640.0642.9650.5657.3662.8673.0681.2686.2691.4697.0711.1721.2725.6Finalsales <strong>of</strong>domesticproduct490.0510.1528.9565.5597.5643.0693.0756.0803.8880.2949.81,008.41,089.21,197.11,331.91,444.41,591.51,751.71,949.42,204.82,475.92,717.53,005.23,165.53,410.63.706.14,014.14,260.04,513.74,884.25,217.55,539.35,731.66,031.26,357.23,241.43,527.13,818.14,107.94,355.44,623.75,027.35,314.65,452.45,507.65,575.35,621.85,651.65,720.85,759.15,794.85,913.95,978.66,049.96.182.56,227.16,314.56,388.26,499.0Grossdomesticpurchases'495.8510.9528.4569.1599.8642.5698.8767.9812.9890.6960.71.009.51,100.21,215.01,349.01,461.81,572.31,770.71,997.82,258.82,512.52,722.83,045.33,170.23,456.53,879.94,154.34,401.24,683.05,008.45,330.55,617.55,742.56,068.26,439.73,224.63,619.13,976.24,276.04,469.84,826.25,150.75,418.75,535.95,602.25,662.45,669.55,665.85,709.25,778.45,816.75,915.86,025.36,098.36,233.26,309.96,392.76,467.86,588.5Addendum:Grossnationalproduct2497.0516.6535.4575.8607.7653.0708.1774.9819.8895.5965.61,017.11,104.91,215.71,362.31,474.31,599.11,785.51,994.62,254.52,520.82,742.13,063.83,179.83,434.43,801.54,053.64,277.74,544.54,908.25,266.85,567.85,737.16,045.83,222.63,578.43,890.24,156.24,340.54,690.55,054.35,365.05,482.15,559.35,599.95,630.05,656.15,710.65,766.25,815.55,927.65,996.36,067.36,191.96,262.16,327.16,402.3Percent changefrom precedingperiodGrossdomesticproduct8.73.93.67.55.57.48.49.55.89.27.95.38.610.011.88.18.711.511.613.111.58.811.93.98.110.96.95.76.47.97.25.63.25.55.69.15.93.11.02.44.84.33.27.45.74.69.24.44.34.47.4Grossdomesticpurchases'9.13.03.47.75.47.18.89.95.99.67.95.19.010.411.08.47.612.612.813.111.28.411.84.19.012.27.15.96.46.96.45.42.25.76.18.94.94.4.5-.33.14.92.77.07.64.99.15.05.44.87.71 Gross domestic product (GDP) less exports <strong>of</strong> goods and services plus imports <strong>of</strong> goods and services.2 GDP plus net receipts <strong>of</strong> factor income from rest <strong>of</strong> <strong>the</strong> world.Source-. Department <strong>of</strong> Commerce, Bureau <strong>of</strong> <strong>Economic</strong> Analysis.269
- Page 1:
S : Sf:' ;: W^W't-^WW': ;, S 4 Si :
- Page 5:
unitedminds
- Page 9 and 10:
Economic Report of the PresidentTo
- Page 11:
the Technology Reinvestment Project
- Page 14:
formed health care system, increase
- Page 19 and 20:
CONTENTSPageCHAPTER 1. A STRATEGY F
- Page 21:
PageProviding Comprehensive Benefit
- Page 24 and 25:
LIST OF CHARTS—CONTINUEDPage3-5 L
- Page 27 and 28:
CHAPTER 1A Strategy for Growth and
- Page 29 and 30:
which have left consumers and busin
- Page 31 and 32:
that growth in both real compensati
- Page 33 and 34:
for inflation was on average roughl
- Page 35 and 36:
Box 1-2.—Saving, Investment, and
- Page 37 and 38:
investments in human capital; inves
- Page 39 and 40:
of the income distribution (Table 1
- Page 41 and 42:
Box 1-3.—Credible Deficit Reducti
- Page 43 and 44:
Chart 1-7 Correlation of Investment
- Page 45 and 46:
Box 1~4*~-A Balanced Budget Amendme
- Page 47 and 48:
This educational record is not good
- Page 49 and 50:
fallen markedly since the 1960s (Ch
- Page 51 and 52:
The development and deployment of n
- Page 53 and 54:
Earlier rounds of GATT talks had fo
- Page 55 and 56:
Chart 1-10 Projected Real Growth Ra
- Page 57 and 58:
are therefore on the public dole. M
- Page 59:
prise communities and be granted sm
- Page 62 and 63:
ingredient that should allow the ec
- Page 64 and 65:
Chart 2-2 National Defense Purchase
- Page 66 and 67:
Chart 2-3 Growth of U.S. Merchandis
- Page 68 and 69:
Chart 2-5 Households: Credit Market
- Page 70 and 71:
THE HEADWINDS ARE MOSTLY CALMINGAs
- Page 72 and 73:
1993, real consumer spending increa
- Page 74 and 75:
RESIDENTIAL INVESTMENTResidential i
- Page 76 and 77:
smallest annual increase in 20 year
- Page 78 and 79:
ments with the Internal Revenue Ser
- Page 80 and 81:
safe-harbor rules for underpayment
- Page 82 and 83:
Chart 2-9 Alternative Measures of t
- Page 84 and 85:
Meanwhile, the Mountain States were
- Page 86 and 87:
inflation is measured by the Blue C
- Page 88 and 89:
Saving, Investment, and Capital Acc
- Page 90 and 91:
the future should be reflected in l
- Page 92 and 93:
Chart 2-15 Dynamic Effects of Defic
- Page 94 and 95:
joyed healthy average real GDP grow
- Page 96 and 97:
Chart 2-16 Personal Income Taxes as
- Page 98 and 99:
TABLE 2-2.— Administration Foreca
- Page 100 and 101:
TABLE 2-3.— Accounting for Growth
- Page 103 and 104:
CHAPTER 3Trends and Recent Developm
- Page 105 and 106:
first quarter of 1991, nonfarm payr
- Page 107 and 108:
cause defense cutbacks have caused
- Page 109 and 110:
UNEMPLOYMENT AND NONEMPLOYMENTThe U
- Page 111 and 112:
Chart 3-3 Civilian Unemployment Rat
- Page 113 and 114:
Chart 3-6 Employment-to-Population
- Page 115 and 116:
Chart 3-8 Ratio of White-Collar to
- Page 117 and 118:
than would be expected given its hi
- Page 119 and 120:
that the natural rate is falling? M
- Page 121 and 122:
SLOW INCOME GROWTHIncome trends hav
- Page 123 and 124:
Chart 3-10 Average Annual Growth of
- Page 125 and 126:
Box 3-3.—Consequences of Producti
- Page 127 and 128:
likely that immigration could expla
- Page 129 and 130:
We do, however, know how many worke
- Page 131 and 132:
size. No data are available on vola
- Page 133 and 134:
BENEFITSOne of the concerns raised
- Page 135 and 136:
edented partnership to develop a nu
- Page 137 and 138:
CHAPTER 4Health Care ReformTHE UNIT
- Page 139 and 140:
make cost-conscious decisions. In a
- Page 141 and 142:
A third rationale for universal cov
- Page 143 and 144:
Box 4-1.—Moral Hazard and Adverse
- Page 145 and 146:
ies depending on one's health statu
- Page 147 and 148:
than people in other countries do,
- Page 149 and 150:
sumers are ill equipped to bring st
- Page 151 and 152:
By itself, the aging of the populat
- Page 153 and 154:
TABLE 4-3.- Sources and Uses of Hea
- Page 155 and 156:
about 65 to 70 cents for a typical
- Page 157 and 158:
THE ARCHITECTURE OF THE HEALTHSECUR
- Page 159 and 160:
etary savings for the Federal Gover
- Page 161 and 162:
contribution, within limits. Outsid
- Page 163 and 164:
salary income, payments from the em
- Page 165 and 166:
TABLE 4-6.—Caps on Premiums by Fi
- Page 167 and 168:
An example will illustrate the proc
- Page 169 and 170:
TABLE 4-9.—Sources and Uses of Fe
- Page 171 and 172:
Chart 4-9 Business Spending on Heal
- Page 173:
Health care reform should set the s
- Page 176 and 177:
and private sectors, addressing env
- Page 178 and 179:
Box 5-1.—Selected National Perfor
- Page 180 and 181:
Box 5-2*—Market PowerFirms are sa
- Page 182 and 183:
ate regulation. For example, State
- Page 184 and 185:
competitiveness of U.S. industry, a
- Page 186 and 187:
Box 5-4.—ExternalitiesAn external
- Page 188 and 189:
in the habitat of the spotted owl r
- Page 190 and 191:
CLIMATE CHANGE ACTION PLANCertain g
- Page 192 and 193:
eral, lays a foundation for broader
- Page 194 and 195:
The Administration's proposal seeks
- Page 196 and 197:
vances in technical know-how have a
- Page 198 and 199:
Investments in R&D are risky. Like
- Page 200 and 201:
1950s and 1960s, and American compa
- Page 202 and 203:
ico and Lawrence Livermore in Calif
- Page 204 and 205:
of industry. MOCs will be affiliate
- Page 206 and 207:
tiveness. Again, the hoped-for resu
- Page 208 and 209:
forts to cut the massive Federal bu
- Page 210 and 211:
TECHNOLOGY POLICY, GROWTH, ANDCOMPE
- Page 212 and 213:
mitment to an open international tr
- Page 214 and 215:
ses, which take such intersectoral
- Page 216 and 217:
An important sectoral development i
- Page 218 and 219:
TABLE 6-3.—Stock of U.S. Outward
- Page 220 and 221:
technical change has been offered a
- Page 222 and 223:
ent account is a broader measure of
- Page 224 and 225: TABLE 6-6.—Intrafirm Trade as Sha
- Page 226 and 227: greater access to the Japanese mark
- Page 228 and 229: the transparency of its trade regim
- Page 230 and 231: that if the states of the former So
- Page 232 and 233: Box 6-3.—Mexican Economic Reforms
- Page 234 and 235: 1998, while nontariff barriers on a
- Page 236 and 237: ward convergence in environmental a
- Page 238 and 239: Box 6-4.—The Asian "Miracle"Per c
- Page 240 and 241: Box 6-5.—The Economic Impact of t
- Page 242 and 243: development, and environmental clea
- Page 244 and 245: THE TRADE POLICY AGENDABy lowering
- Page 246 and 247: ignated monopolies. It also establi
- Page 248 and 249: The dollar ended 1993 roughly where
- Page 250 and 251: Box 6-7.—Exchange-Rate Volatility
- Page 252 and 253: Chart 6-5 French Franc-Deutsche Mar
- Page 254 and 255: Besides bringing these endeavors to
- Page 257 and 258: LETTER OF TRANSMITTALCOUNCIL OF ECO
- Page 259 and 260: Report to the President on the Acti
- Page 261 and 262: duction budget package, the North A
- Page 263 and 264: Working Group studying cost-benefit
- Page 265 and 266: prepares the Economic Indicators an
- Page 267: Appendix BSTATISTICAL TABLES RELATI
- Page 270 and 271: POPULATION, EMPLOYMENT, WAGES, AND
- Page 272 and 273: AGRICULTURE:PageB-96. Farm income,
- Page 276 and 277: TABLE B-2.—Gross domestic product
- Page 278 and 279: TABLE B-3.—Implicit price deflato
- Page 280 and 281: TABLE B-4.—Fixed-weighted price i
- Page 282 and 283: TABLE B-5.—Changes in gross domes
- Page 284 and 285: TABLE B-7.—Cross domestic product
- Page 286 and 287: TABLE B-9.—Gross domestic product
- Page 288 and 289: TABLE B-ll.—Gross domestic produc
- Page 290 and 291: TABLE B-13.—Gross domestic produc
- Page 292 and 293: TABLE B-15.—Personal consumption
- Page 294 and 295: TABLE B-17.—Gross and net private
- Page 296 and 297: TABLE B-19.—Inventories and final
- Page 298 and 299: TABLE B-21.—Foreign transactions
- Page 300 and 301: TABLE B-23.—Relation of gross dom
- Page 302 and 303: TABLE B-25.—National income by ty
- Page 304 and 305: TABLE B-26.—Sources of personal i
- Page 306 and 307: TABLE B-27.—Disposition of person
- Page 308 and 309: TABLE B-29.—Gross sating and inve
- Page 310 and 311: TABLE B-31.—Median money income (
- Page 312 and 313: TABLE B-33.—Population and the la
- Page 314 and 315: TABLE B-34.—Civilian employment a
- Page 316 and 317: TABLE B-36.—Unemployment by demog
- Page 318 and 319: TABLE B-38.—Civilian labor force
- Page 320 and 321: TABLE B-40.—Civilian unemployment
- Page 322 and 323: TABLE B-42.—Unemployment by durat
- Page 324 and 325:
TABLE B-44.—Employees on nonagric
- Page 326 and 327:
TABLE B-45.—Hours and earnings in
- Page 328 and 329:
TABLE B-47.—Productivity and rela
- Page 330 and 331:
PRODUCTION AND BUSINESS ACTIVITYTAB
- Page 332 and 333:
TABLE B-51.—Industrial production
- Page 334 and 335:
TABLE B-53.—New construction acti
- Page 336 and 337:
TABLE B-54.—New housing units sta
- Page 338 and 339:
Year or monthTABLE B-56.—Manufact
- Page 340 and 341:
TABLE B-58.—Manufacturers' new an
- Page 342 and 343:
TABLE B-60.—Consumer price indexe
- Page 344 and 345:
TABLE B-61.—Consumer price indexe
- Page 346 and 347:
TABLE B-63.—Changes in consumer p
- Page 348 and 349:
TABLE B-64.—Producer price indexe
- Page 350 and 351:
TABLE B-66.—Producer price indexe
- Page 352 and 353:
TABLE B-67.—Changes in producer p
- Page 354 and 355:
TABLE B-69.—Components of money s
- Page 356 and 357:
TABLE B-70.—Aggregate reserves of
- Page 358 and 359:
TABLE B-72.—Bond yields and inter
- Page 360 and 361:
TABLE B-73.—Total funds raised in
- Page 362 and 363:
TABLE B-74.—Mortgage debt outstan
- Page 364 and 365:
TABLE B-76.—Consumer credit outst
- Page 366 and 367:
TABLE B-78.—Federal receipts, out
- Page 368 and 369:
TABLE B-79.—Federal budget receip
- Page 370 and 371:
TABLE B-81.—Federal and State and
- Page 372 and 373:
TABLE B-83.—State and local gover
- Page 374 and 375:
TABLE B-85.—Interest-bearing publ
- Page 376 and 377:
TABLE B-87.—Estimated ownership o
- Page 378 and 379:
TABLE B-89.—Corporate profits by
- Page 380 and 381:
TABLE B-91.—Sales, profits, and s
- Page 382 and 383:
TABLE B-93.—Sources and uses of f
- Page 384 and 385:
TABLE B-95.—Business formation an
- Page 386 and 387:
19481949195019511952195319541955195
- Page 388 and 389:
TABLE B-99.—Indexes of prices rec
- Page 390 and 391:
TABLE B-101.— Farm business balan
- Page 392 and 393:
TABLE B-103.—U.S. international t
- Page 394 and 395:
TABLE B-104.—U.S. merchandise exp
- Page 396 and 397:
TABLE B-106.—U.S. merchandise exp
- Page 398 and 399:
TABLE B-108.—Industrial productio
- Page 400 and 401:
TABLE B-110.—Foreign exchange rat
- Page 402 and 403:
NATIONAL WEALTHTABLE B-l 12.—Nati
- Page 404:
SUPPLEMENTARY TABLETABLE B-114.—S