TABLE B-23.—Relation <strong>of</strong> gross domestic product, gross national product, net national product, andnationaI income, 1959-93[Billions <strong>of</strong> dollars; quarterly data at seasonally adjusted annual rates]Year orquarterGrossdomesticproductPIUS:Receipts<strong>of</strong> factorincomefrom rest<strong>of</strong> <strong>the</strong>world '19591960196119621963196419651966156719681969 .197019711972197319741975197619771978197919801981198219831984198519861987198819891990199119921993 p1982: IV1983: IV1984: IV1985: IV1986: IV1987: IV1988: IV1989: IV1990:1IIIllIV1991:1IIIllIV1992:1IIIllIV1993:1IIIllIV..494.2513.3531.8571.6603.1648 0702.7769.8814.3889.3959 51,010.71,097.21,207.01,349.61,458.61,585.91,768.41,974.12,232.72 488 62,708.03,030.63,149.63,405.03,777.24,038.74,268.64,539.94,900.45 250 85,546.15,722.96,038.56 374 03,195.13,547.33,869.14,140.54,336.64,683.05,044.65,344.85,461.95,540.95,583.85,597.95,631.75,697.75,758.65,803.75,908.75,991.46,059.56,194.46,261.66,327.66,395.96,510.84.35.05.46.16.6748.18.38.910.311913.014.116.423.830.328.232.837.747.169 780.694.197.395.8108.197.396.0105.1128.7157 5168.6146.1129.291.9102.1106.698.192.8114.4139.9159.3164.0165.4165.2179.7162.4147.2139.1135.7134.4132.9127.3122.3122.8131.9135.1Less:Payments<strong>of</strong> factorincome torest <strong>of</strong><strong>the</strong>world 2 1.5Equals:GrossnationalproductLess:Consumption<strong>of</strong>fixedcapitalEquals:NetnationalproductIndirectbusinesstax andnontaxliabilityLess:BusinesstransferpaymentsStatisticaldiscrepancyPIUS:Subsidieslesscurrentsurplus<strong>of</strong>governmententerprisesEquals:Nationalincome1.81.81.82.1242.73.13.44.1586.66.47.711.114.614.915.717.225.337 546.560.967.166.583.882.486.9100.5120.8141 5146.9131.9121.964.471.085.582.488.9106.9130 2139.1143.8147.0149.0147.7138.0134.3131.5123.9115.6127.9119.5124.8122.4132.3128.7497 0516.6535.4575.8607.7653 0708.1774.9819.8895.5965 61,017.11,104.91,215.71,362.31,474.31,599.11,785.51,994.62,254.52 520 82,742.13,063.83,179.83,434.43,801.54,053.64,277.74,544.54,908.25 266 85,567.85,737.16,045.83,222.63,578.43,890.24,156.24,340.54,690.55,054 35,365.05,482.15,559.35,599.95,630.05,656.15,710.65,766.25,815.55,927.65,996.36,067.36,191.96,262.16,327.16,402.344 646.347.749.351.353 957.362.167.473.981588.897.6109.9120.4140.2165.2182.8205.2234.8272 4311.9362.4399.1418.4433.2454.5478.6502.2534.0580 4602.7626.1657.96712412.5439.7448.0465.6488.2512.1547 2600.8590.2597.9607.8614.8619.9622.3626.7635.4631.7637.2714.6648.0663.2663.3679.7678.7452.5470.2487.7526.5556.4599 2650.7712.8752.4821.5884 2928.31,007.31,105.71,241.91,334.11,433.91,602.71,789.42,019.82 248 42,430.22,701.42,780.83,016.03,368.33,599.13,799.24,042.44,374.24 686 44,965.15,111.05,387.92,810.13,138.73,442.23,690.73,852.34,178.54,507.24,764.24,891.94,961.44,992.25,015.15,036.25,088.35,139.65,180.05,295.95,359.15,352.85,543.95,598.85,663.95,722.641945.548.151.754.758 862.765.470.479.086 694.3103.6111.4121.0129.3140.0151.6165.5177.8188 7212.0249.3256.4280.1309.5329.9345.5365.0385.3414 7444.0476.6502.8530 5262.3291.7317.7335.1351.6372.3394.2424.4436.2437.2448.0454.8465.6470.5481.3488.9493.4497.3504.8515.7515.6526.2532.4547.91.41.41.51.61.8202.22.32.52.8313.23.43.94.55.05.26.57.38.29911.213.415.416.619.021.024.224.025.626 626.826.327.628 016.018.120.222.224.924.227.226.226.327.027.126.726.126.326.026.627.027.627.828.127.027.828.428.8-1.8-3.1-2.2-1.0-2.07-.72.8.8-.126.03.11.1-.51.46.010.410.97.613 813.610.9-7.410.2-9.0-13.91.2-24.8-28.4117.89.623.6-10.113.8-20.5-5.9-2.0-24.9-25.412.813.1-1.814.94.9.24.527.36.223.123.615.732.134.412.013.3-0.9-.8.2.3-.31.31.41.21.2152.62.43.42.6.42.61.43.33.6294.84.76.211.79.56.49.714.110.9544.57.7729.619.29.72.68.222.016.54.49.93.0-5.610.41.8.8-8.04.33.03.9-3.77.717.16.1-5.310.7410.1425.7440.5474.5501.55391586.9643.7679.9741.0798.6833,5899.5992.91,119.51,198.81,285.31,435.51,609.11,829.82,038 92,198.22,432.52,522.52,720.83,058.33,268.43,437.93,692.34,002.64 249 54,491.04,598.34,836.62,551.52,834.33,134.43,341.93,486.03,828.84,127.64,305.24,426.24,502.04,496.64,539.24,546.04,587.84,596.94,662.64,755.44,814.64,800.84,975.85,038.95,104.05,143.21 Consists largely <strong>of</strong> receipts by U.S. residents <strong>of</strong> interest and dividends and reinvested earnings <strong>of</strong> foreign affiliates <strong>of</strong> U.S.corporations.2 Consists largely <strong>of</strong> payments to foreign residents <strong>of</strong> interest and dividends and reinvested earnings <strong>of</strong> U.S. affiliates <strong>of</strong> foreigncorporations.Source: Department <strong>of</strong> Commerce, Bureau <strong>of</strong> <strong>Economic</strong> Analysis.294
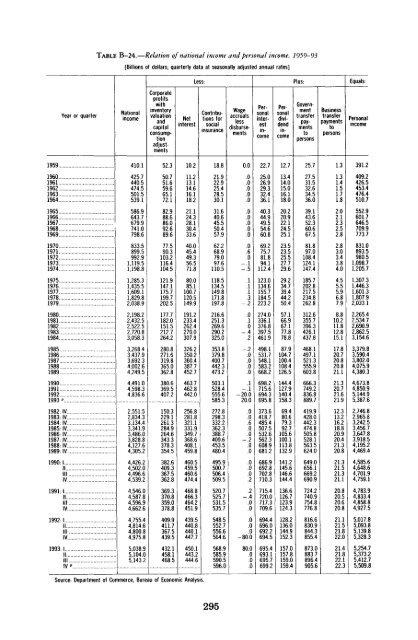
TABLE B-24.—Relation <strong>of</strong> national income and personal income, 1959-93[Billions <strong>of</strong> dollars; quarterly data at seasonally adjusted annual rates]Year or quarter195919601961196219631964196519661967!19681969197019711972197319741975197619771978197919801981198219831984198519861987198819891990199119921993"1982 IV1983 IV1984 IV1985 IV1986 IV1987 IV1988 IV1989 IV1990 1 IIIIIIV1991 1 IIIIIIV1992 1 IIIIIIV1993 1 IIIIIIV PNationalincome410.1425.7440.5474.5501.5539.1586.9643.7679.9741.0798.6833.5899.5992.91,119.51,198.81,285.31,435.51,609.11,829.82,038.92,198.22,432.52,522.52,720.83,058.33,268.43,437.93,692.34,002.64,249.54,491.04,598.34,836.62,551.52,834.33,134.43,341.93,486.03,828.84,127.64,305.24,426.24,502.04,496.64,539.24,546.04,587.84,596.94,662.64,755.44,814.64,800.84,975.85,038.95,104.05,143.2Less:Corporatepr<strong>of</strong>itswithinventoryvaluationandcapitalconsumptionadjustments52.350.751.659.665.172.182.988.686.092.689.677.590.3103.2116.4104.5121.9147.1175.7199.7202.5177.7182.0151.5212.7264.2280.8271.6319.8365.0362.8380.6369.5407.2150.3229.1261.3284.9264.6343.3378.3354.5382.6409.3367.5362.8369.3370.8359.0378.8409.9411.7367.5439.5432.1458.1468.5Netinterest10.211.213.114.616.118.221.124.328.130.433.640.045.449.356.571.880.085.1100.7120.5149.9191.2233.4262.4270.0307.9326.2350.2360.4387.7452.7463.7462.8442.0256.8281.8321.1331.9349.7368.6408.1459.8460.5459.5460.6474.4468.8466.3464.2451.9439.5440.8440.1447.7450.1443.2444.6Contributionsforsocialinsurance18.821.922.925.428.530.131.640.645.550.457.962.268.979.097.6110.5118.5134.5149.8171.8197.8216.6251.3269.6290.2325.0353.8379.8400.7442.3473.2503.1528.4555.6585.3272.8298.3332.2362.3388.7409.6453.5480.4495.9500.7506.4509.5520.7525.7531.5535.7548.5552.7556.6564.6568.9585.9590.5596.0Wageaccrualslessdisbursements0.0.0.0.0.0.0.0.0.0.0.0.0.6.0-.1-.5.1.1.1.3-.2.0,1.0- 4.2-.2 .0.0.0.0.1-.1-20.020.0.0.0.6.0.0-.2 .0.0.0.0.0.2.2-.4 .0.0.0.0.0-80.080.0.0.0.0Personalinterestincome22.725.026.929.332.436.140.344.949.554.660.869.275.781.894.1112.4123.0134.6155.7184.5223.2274.0336.1376.8397.5461.9498.1531.7548.1583.2668.2698.2715.6694.3695.8373.6418.7485.4507.5532.6562.3608.9681.2686.9692.8702.8710.3715.4720.0717.3709.6694.4696.0692.2694.5695.4693.1695.7699.2Personaldividendincome12.713.414.015.016.118.020.220.922.124.525.123.523.525.527.729.629.234.739.444.250.457.166.967.177.878.887.9104.7100.4108.4126.5144.4127.9140.4158.369.480.679.392.7105.6100.1113.8132.9141.2145.6146.6144.4136.6126.7123.9124.3128.2136.0144.9152.3157.0157.8159.0159.4>IUS:Governmenttransferpaymentstopersons25.727.531.532.634.536.039.143.652.360.667.581.897.0108.4124.1147.4185.7202.8217.5234.8262.8312.6355.7396.3426.1437.8468.1497.1521.3555.9603.8666.3749.2836.8889.7419.9428.0442.3474.8505.8528.1563.5624.0649.0656.1669.2690.9724.2740.9754.8776.8816.6830.9844.3855.4873.0883.7896.4905.6Businesstransferpaymentstopersons1.31.31.41.51.71.82.02.12.32.52.82.83.03.43.84.04.55.55.96.87.98.810.211.812.815.117.820.720.820.821.121.320.721.621.912.313.216.218.820.920.421.320.821.321.521.321.120.820.520.620.821.121.521.822.021.421.822.122.3Equals:Personalincome391.2409.2426.5453.4476.4510.7552.9601.7646.5709.9773.7831.0893.5980.51,098.71,205.71,307.31,446.31,601.31,807.92,033.12,265.42,534.72,690.92,862.53,154.63,379.83,590.43,802.04,075.94,380.34,673.84,850.95,144.95,387.62,746.82,965.33,242.53,456.73,647.83,918.54,195.24,469.44,585.64,648.64,701.94,759.14,783.94,833.44,858.84,927.55,017.85,093.85,139.85,328.35,254.75,373.25,412.75,509.8Source: Department <strong>of</strong> Commerce, Bureau <strong>of</strong> <strong>Economic</strong> Analysis.295
- Page 1:
S : Sf:' ;: W^W't-^WW': ;, S 4 Si :
- Page 5:
unitedminds
- Page 9 and 10:
Economic Report of the PresidentTo
- Page 11:
the Technology Reinvestment Project
- Page 14:
formed health care system, increase
- Page 19 and 20:
CONTENTSPageCHAPTER 1. A STRATEGY F
- Page 21:
PageProviding Comprehensive Benefit
- Page 24 and 25:
LIST OF CHARTS—CONTINUEDPage3-5 L
- Page 27 and 28:
CHAPTER 1A Strategy for Growth and
- Page 29 and 30:
which have left consumers and busin
- Page 31 and 32:
that growth in both real compensati
- Page 33 and 34:
for inflation was on average roughl
- Page 35 and 36:
Box 1-2.—Saving, Investment, and
- Page 37 and 38:
investments in human capital; inves
- Page 39 and 40:
of the income distribution (Table 1
- Page 41 and 42:
Box 1-3.—Credible Deficit Reducti
- Page 43 and 44:
Chart 1-7 Correlation of Investment
- Page 45 and 46:
Box 1~4*~-A Balanced Budget Amendme
- Page 47 and 48:
This educational record is not good
- Page 49 and 50:
fallen markedly since the 1960s (Ch
- Page 51 and 52:
The development and deployment of n
- Page 53 and 54:
Earlier rounds of GATT talks had fo
- Page 55 and 56:
Chart 1-10 Projected Real Growth Ra
- Page 57 and 58:
are therefore on the public dole. M
- Page 59:
prise communities and be granted sm
- Page 62 and 63:
ingredient that should allow the ec
- Page 64 and 65:
Chart 2-2 National Defense Purchase
- Page 66 and 67:
Chart 2-3 Growth of U.S. Merchandis
- Page 68 and 69:
Chart 2-5 Households: Credit Market
- Page 70 and 71:
THE HEADWINDS ARE MOSTLY CALMINGAs
- Page 72 and 73:
1993, real consumer spending increa
- Page 74 and 75:
RESIDENTIAL INVESTMENTResidential i
- Page 76 and 77:
smallest annual increase in 20 year
- Page 78 and 79:
ments with the Internal Revenue Ser
- Page 80 and 81:
safe-harbor rules for underpayment
- Page 82 and 83:
Chart 2-9 Alternative Measures of t
- Page 84 and 85:
Meanwhile, the Mountain States were
- Page 86 and 87:
inflation is measured by the Blue C
- Page 88 and 89:
Saving, Investment, and Capital Acc
- Page 90 and 91:
the future should be reflected in l
- Page 92 and 93:
Chart 2-15 Dynamic Effects of Defic
- Page 94 and 95:
joyed healthy average real GDP grow
- Page 96 and 97:
Chart 2-16 Personal Income Taxes as
- Page 98 and 99:
TABLE 2-2.— Administration Foreca
- Page 100 and 101:
TABLE 2-3.— Accounting for Growth
- Page 103 and 104:
CHAPTER 3Trends and Recent Developm
- Page 105 and 106:
first quarter of 1991, nonfarm payr
- Page 107 and 108:
cause defense cutbacks have caused
- Page 109 and 110:
UNEMPLOYMENT AND NONEMPLOYMENTThe U
- Page 111 and 112:
Chart 3-3 Civilian Unemployment Rat
- Page 113 and 114:
Chart 3-6 Employment-to-Population
- Page 115 and 116:
Chart 3-8 Ratio of White-Collar to
- Page 117 and 118:
than would be expected given its hi
- Page 119 and 120:
that the natural rate is falling? M
- Page 121 and 122:
SLOW INCOME GROWTHIncome trends hav
- Page 123 and 124:
Chart 3-10 Average Annual Growth of
- Page 125 and 126:
Box 3-3.—Consequences of Producti
- Page 127 and 128:
likely that immigration could expla
- Page 129 and 130:
We do, however, know how many worke
- Page 131 and 132:
size. No data are available on vola
- Page 133 and 134:
BENEFITSOne of the concerns raised
- Page 135 and 136:
edented partnership to develop a nu
- Page 137 and 138:
CHAPTER 4Health Care ReformTHE UNIT
- Page 139 and 140:
make cost-conscious decisions. In a
- Page 141 and 142:
A third rationale for universal cov
- Page 143 and 144:
Box 4-1.—Moral Hazard and Adverse
- Page 145 and 146:
ies depending on one's health statu
- Page 147 and 148:
than people in other countries do,
- Page 149 and 150:
sumers are ill equipped to bring st
- Page 151 and 152:
By itself, the aging of the populat
- Page 153 and 154:
TABLE 4-3.- Sources and Uses of Hea
- Page 155 and 156:
about 65 to 70 cents for a typical
- Page 157 and 158:
THE ARCHITECTURE OF THE HEALTHSECUR
- Page 159 and 160:
etary savings for the Federal Gover
- Page 161 and 162:
contribution, within limits. Outsid
- Page 163 and 164:
salary income, payments from the em
- Page 165 and 166:
TABLE 4-6.—Caps on Premiums by Fi
- Page 167 and 168:
An example will illustrate the proc
- Page 169 and 170:
TABLE 4-9.—Sources and Uses of Fe
- Page 171 and 172:
Chart 4-9 Business Spending on Heal
- Page 173:
Health care reform should set the s
- Page 176 and 177:
and private sectors, addressing env
- Page 178 and 179:
Box 5-1.—Selected National Perfor
- Page 180 and 181:
Box 5-2*—Market PowerFirms are sa
- Page 182 and 183:
ate regulation. For example, State
- Page 184 and 185:
competitiveness of U.S. industry, a
- Page 186 and 187:
Box 5-4.—ExternalitiesAn external
- Page 188 and 189:
in the habitat of the spotted owl r
- Page 190 and 191:
CLIMATE CHANGE ACTION PLANCertain g
- Page 192 and 193:
eral, lays a foundation for broader
- Page 194 and 195:
The Administration's proposal seeks
- Page 196 and 197:
vances in technical know-how have a
- Page 198 and 199:
Investments in R&D are risky. Like
- Page 200 and 201:
1950s and 1960s, and American compa
- Page 202 and 203:
ico and Lawrence Livermore in Calif
- Page 204 and 205:
of industry. MOCs will be affiliate
- Page 206 and 207:
tiveness. Again, the hoped-for resu
- Page 208 and 209:
forts to cut the massive Federal bu
- Page 210 and 211:
TECHNOLOGY POLICY, GROWTH, ANDCOMPE
- Page 212 and 213:
mitment to an open international tr
- Page 214 and 215:
ses, which take such intersectoral
- Page 216 and 217:
An important sectoral development i
- Page 218 and 219:
TABLE 6-3.—Stock of U.S. Outward
- Page 220 and 221:
technical change has been offered a
- Page 222 and 223:
ent account is a broader measure of
- Page 224 and 225:
TABLE 6-6.—Intrafirm Trade as Sha
- Page 226 and 227:
greater access to the Japanese mark
- Page 228 and 229:
the transparency of its trade regim
- Page 230 and 231:
that if the states of the former So
- Page 232 and 233:
Box 6-3.—Mexican Economic Reforms
- Page 234 and 235:
1998, while nontariff barriers on a
- Page 236 and 237:
ward convergence in environmental a
- Page 238 and 239:
Box 6-4.—The Asian "Miracle"Per c
- Page 240 and 241:
Box 6-5.—The Economic Impact of t
- Page 242 and 243:
development, and environmental clea
- Page 244 and 245:
THE TRADE POLICY AGENDABy lowering
- Page 246 and 247:
ignated monopolies. It also establi
- Page 248 and 249:
The dollar ended 1993 roughly where
- Page 250 and 251: Box 6-7.—Exchange-Rate Volatility
- Page 252 and 253: Chart 6-5 French Franc-Deutsche Mar
- Page 254 and 255: Besides bringing these endeavors to
- Page 257 and 258: LETTER OF TRANSMITTALCOUNCIL OF ECO
- Page 259 and 260: Report to the President on the Acti
- Page 261 and 262: duction budget package, the North A
- Page 263 and 264: Working Group studying cost-benefit
- Page 265 and 266: prepares the Economic Indicators an
- Page 267: Appendix BSTATISTICAL TABLES RELATI
- Page 270 and 271: POPULATION, EMPLOYMENT, WAGES, AND
- Page 272 and 273: AGRICULTURE:PageB-96. Farm income,
- Page 274 and 275: NATIONAL INCOME OR EXPENDITURETABLE
- Page 276 and 277: TABLE B-2.—Gross domestic product
- Page 278 and 279: TABLE B-3.—Implicit price deflato
- Page 280 and 281: TABLE B-4.—Fixed-weighted price i
- Page 282 and 283: TABLE B-5.—Changes in gross domes
- Page 284 and 285: TABLE B-7.—Cross domestic product
- Page 286 and 287: TABLE B-9.—Gross domestic product
- Page 288 and 289: TABLE B-ll.—Gross domestic produc
- Page 290 and 291: TABLE B-13.—Gross domestic produc
- Page 292 and 293: TABLE B-15.—Personal consumption
- Page 294 and 295: TABLE B-17.—Gross and net private
- Page 296 and 297: TABLE B-19.—Inventories and final
- Page 298 and 299: TABLE B-21.—Foreign transactions
- Page 302 and 303: TABLE B-25.—National income by ty
- Page 304 and 305: TABLE B-26.—Sources of personal i
- Page 306 and 307: TABLE B-27.—Disposition of person
- Page 308 and 309: TABLE B-29.—Gross sating and inve
- Page 310 and 311: TABLE B-31.—Median money income (
- Page 312 and 313: TABLE B-33.—Population and the la
- Page 314 and 315: TABLE B-34.—Civilian employment a
- Page 316 and 317: TABLE B-36.—Unemployment by demog
- Page 318 and 319: TABLE B-38.—Civilian labor force
- Page 320 and 321: TABLE B-40.—Civilian unemployment
- Page 322 and 323: TABLE B-42.—Unemployment by durat
- Page 324 and 325: TABLE B-44.—Employees on nonagric
- Page 326 and 327: TABLE B-45.—Hours and earnings in
- Page 328 and 329: TABLE B-47.—Productivity and rela
- Page 330 and 331: PRODUCTION AND BUSINESS ACTIVITYTAB
- Page 332 and 333: TABLE B-51.—Industrial production
- Page 334 and 335: TABLE B-53.—New construction acti
- Page 336 and 337: TABLE B-54.—New housing units sta
- Page 338 and 339: Year or monthTABLE B-56.—Manufact
- Page 340 and 341: TABLE B-58.—Manufacturers' new an
- Page 342 and 343: TABLE B-60.—Consumer price indexe
- Page 344 and 345: TABLE B-61.—Consumer price indexe
- Page 346 and 347: TABLE B-63.—Changes in consumer p
- Page 348 and 349: TABLE B-64.—Producer price indexe
- Page 350 and 351:
TABLE B-66.—Producer price indexe
- Page 352 and 353:
TABLE B-67.—Changes in producer p
- Page 354 and 355:
TABLE B-69.—Components of money s
- Page 356 and 357:
TABLE B-70.—Aggregate reserves of
- Page 358 and 359:
TABLE B-72.—Bond yields and inter
- Page 360 and 361:
TABLE B-73.—Total funds raised in
- Page 362 and 363:
TABLE B-74.—Mortgage debt outstan
- Page 364 and 365:
TABLE B-76.—Consumer credit outst
- Page 366 and 367:
TABLE B-78.—Federal receipts, out
- Page 368 and 369:
TABLE B-79.—Federal budget receip
- Page 370 and 371:
TABLE B-81.—Federal and State and
- Page 372 and 373:
TABLE B-83.—State and local gover
- Page 374 and 375:
TABLE B-85.—Interest-bearing publ
- Page 376 and 377:
TABLE B-87.—Estimated ownership o
- Page 378 and 379:
TABLE B-89.—Corporate profits by
- Page 380 and 381:
TABLE B-91.—Sales, profits, and s
- Page 382 and 383:
TABLE B-93.—Sources and uses of f
- Page 384 and 385:
TABLE B-95.—Business formation an
- Page 386 and 387:
19481949195019511952195319541955195
- Page 388 and 389:
TABLE B-99.—Indexes of prices rec
- Page 390 and 391:
TABLE B-101.— Farm business balan
- Page 392 and 393:
TABLE B-103.—U.S. international t
- Page 394 and 395:
TABLE B-104.—U.S. merchandise exp
- Page 396 and 397:
TABLE B-106.—U.S. merchandise exp
- Page 398 and 399:
TABLE B-108.—Industrial productio
- Page 400 and 401:
TABLE B-110.—Foreign exchange rat
- Page 402 and 403:
NATIONAL WEALTHTABLE B-l 12.—Nati
- Page 404:
SUPPLEMENTARY TABLETABLE B-114.—S