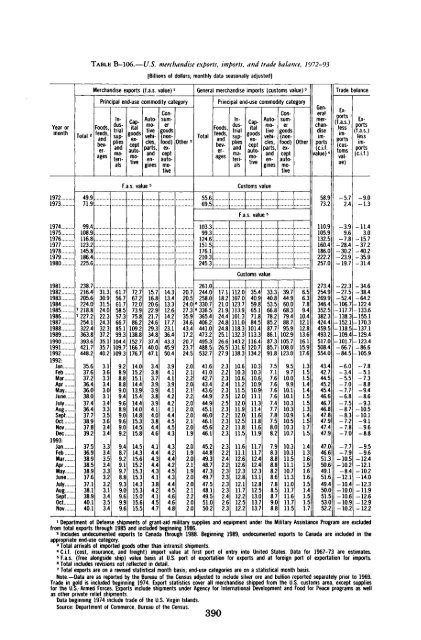
TABLE B-106.—U.S. merchandise exports, imports, and trade balance, 1972-93[Billions <strong>of</strong> dollars; monthly data seasonally adjusted]Year ormonthTotal 2IMerchandise exports (f.a.s. /alue)'Principal end-use commodity categoryFoods,feeds,beveragesIndustrialsuppliesandmaterialsCapitalgoodsceptautomotiveAutomotivevehicles,parts,andenginesConsumergoods(nonfood)O<strong>the</strong>r 2exceptautomotiveGenera merchandise imports (customs value) 3TotalPrincipal end-use commodity categoryFoods,feeds,beveragesIndustrialsuppliesandmaterialsCapitalgoodsceptautomo-ii veAutomotivevehicles,parts,andenginesConsumergoods(nonfood)O<strong>the</strong>rexceptautomotivePeneralmerchandiseimports(ci.f.value) 4Trade balanceEx-•ip\(f.a.s.)lessim-(customsval-Exports(f.a.s.)lessimports(ci.f.)197219731974197519761977 ....1978197919801981198219831984198519861987198819891990199119921992:JanFebMarAprMayJuneJulyAugSeptOctNovDec1993:JanFebMarAprMayJuneJulyAugSeptOctNov49.971.999.4108 9116.8123.2145 8186 4225.6238 7216.4205.6224.07 218.87 227.2254.1322.4363.8393.6421.7448.235.637.637.236.436.038.037.436.437.738.937.839.237.536.938.938.538.937.637.138.138.940.140.131.330.931.524.022.324.332.337.235.135.740.23.13.63.33.43.03.13.43.33.53.63.43.43.33.43.53.43.33.23.23.13.43.53.461.756.761.758.557.366.785.199.3104.4109.7109.3F.a.s. value 59.28.98.88.89.09.49.68.99.09.69.09.29.48.79.29.19.78.89.39.09.69.99.67?.767.272.073.975.886.2109.2138.8152.7166.7176.714.015.215.114.413.915.414.414.014.815.314.515.814.514.315.615.215.315.314.315.315.015.615.515.716.820.622.921.724.629.334.837.440.047.13.43.83.73.93.93.83.94.14.03.84.44.64.14.44.34.44.34.13.84.24.14.54.714.313.413.312.614.217.723.136.443.345.950.43.94.14.13.94.14.24.24.14.44.54.54.34.34.24.44.24.54.34.44.54.64.64.820.720.524.027.335.934.643.417.220.723.724.52.02.12.22.02.12.22.02.02.02.12.01.92.01.92.02.11.92.02.02.12.22.02.055 669.5103 399 3124 61515176 1210 3245.3261 0244.0258.06 330.76 336.5365.4406.2441.0473.2495.3488.5532.741.641.042.743.443.644.944.945.146.046.145.646.145.244.849.348.747.349.747.548.149.551.050.217.118.221.021.924.424.824.825.126.626.527.92.32.22.32.42.32.52.52.32.22.32.22.32.32.22.42.22.32.32.32.32.42.62.3Customs valueF.a.s. value 5Customs value112.0107.0123.7113.9101.3111.0118.3132.3143.2131.6138.310.610.310.611.211.512.012.011.912.012.511.811.511.611.112.612.612.312.812.111.712.212.512.235.440.959.865.171.884.5101.4113.3116.4120.7134.210.310.310.610.910.911.111.311.411.611.811.611.911.711.712.412.412.313.112.812.513.013.713.733.3 39.740.8 44.953.5 60.066.8 68.378.2 79.485.2 88.787.7 95.986.1 102.987.3 105.785.7 108.091.8 123.07.57.17.67.67.67.67.47.77.87.58.08.27.98.38.88.88.28.67.88.58.79.08.89.59.710.09.910.110.110.310.310.910.510.310.710.310.311.511.110.711.311.011.711.611.711.56.56.37.89.410.412.112.813.616.115.917.61.31.51.51.41.41.51.51.31.41.51.71.51.41.31.61.51.61.61.51.41.51.51.758 973.2110.9105 9132.5160.4186 0222 2257.0273 4254.9269.9346.4352.5382.3424.4459.5493.2517.0508.4554.043.442.744.545.245.446.646.746.847.847.947.447.947.046.651.350.649.151.649.450.051.553.052.2-572.4-3996-7.8-28.4-30 223 9-19.7-22 3-27.5-52.4-106.7-6.0-3.4-5.5-7.0-7.7-6.8-7.5-8.7-8.3-7.2-7.8-7.0-7.7-7.9-10.5-10.2-8.4-12.1-10.4-10.0-10.6-10.9-10.2-90-1.3-11430-15.7-37 2-40 235 9-31.434 6-38.4-64.2-122.4-117.7 -133.6-138.3 -155.1-152.1 -170.3-118.5 -137.1-109.4 -129.4-101.7 -123.4-66.7 -86.6-84.5 -105.9-7.8-5.1-7.3-8.8-9.4-8.6-9.3-10.5-10.1-9.1-9.6-8.8-9.5-9.6-12.4-12.1-10.2-14.0-12.3-11.9-12.6-12.S-12.21 Department <strong>of</strong> Defense shipments <strong>of</strong> grant-aid military supplies and equipment under <strong>the</strong> Military Assistance Program are excludedfrom total exports through 1985 and included beginning 1986.2 Includes undocumented exports to Canada through 1988. Beginning 1989, undocumented exports to Canada are included in <strong>the</strong>appropriate end-use category.3 Total arrivals <strong>of</strong> imported goods o<strong>the</strong>r than intransit shipments.4 Ci.f. (cost, insurance, and freight) import value at first port <strong>of</strong> entry into United States. Data for 1967-73 are estimates.5 F.a.s. (free alongside ship) value basis at U.S. port <strong>of</strong> exportation for exports and at foreign port <strong>of</strong> exportation for imports.6 Total includes revisions not reflected in detail.7 Total exports are on a revised statistical month basis; end-use categories are on a statistical month basis.Note.—Data are as reported by <strong>the</strong> Bureau <strong>of</strong> <strong>the</strong> Census adjusted to include silver ore and bullion reported separately prior to 1969.Trade in gold is included beginning 1974. Export statistics cover all merchandise shipped from <strong>the</strong> U.S. customs area, except suppliesfor <strong>the</strong> U.S.- Armed Forces. Exports include shipments under Agency for International Development and Food for Peace programs as wellas o<strong>the</strong>r private relief shipments.Data beginning 1974 include trade <strong>of</strong> <strong>the</strong> U.S. Virgin Islands.Source.- Department <strong>of</strong> Commerce, Bureau <strong>of</strong> <strong>the</strong> Census.390
TABLE B-107.—International reserves, selected years, 1952-93[Millions <strong>of</strong> SDRs; end <strong>of</strong> period]Area and country 1952 1962 1972 1982 1990 1991 1992Oct1993NovAll countries49,38862,851146,658361,253670,678704,672725,652760,728765,608Industrial countries *39,28053,502113,362214,014441,946428,438424,229439,197442,458United StatesCanadaAustraliaJapanNew ZealandAustriaBelgiumDenmarkFinlandFrance24,7141,9449201,1011831161,13315013268617,2202,5611,1682,0212511,0811,7532562374,04912,1125,5725,65616,9167672,5053,5647876649,22429,9183,4286,05322,0015775,5444,7572,1111,42017,85059,95813,06011,71056,0272,9027,3059,5997,5026,84928,71655,76911,81611,83751,2242,0627,9249,5735,2345,38924,73552,9958,6628,42952,9372,2399,70310,9148,0903,86222,52254,7479,2568,31871,3462,52510,0668,8436,4483,47254,6798,7298,34110,3819,0056,4563,650GermanyGreeceIcelandIrelandItalyNe<strong>the</strong>rlands9609483187229536,958287323594,0681,94321,908950781,0385,6054,40743,9099161332,39015,10810,72351,0602,5173083,68446,56513,82747,3753,7473164,02636,36513,98069,4893,3693642,51422,43817,49259,0114,4763214,68523,00124,08960,1102884,69323,73524,072NorwayPortugalSpainSwedenSwitzerlandUnited Kingdom1646031345041,6671,9563046801,0458022,9193,3081,2202,1294,6181,4536,9615,2016,2721,1797,4503,39716,93011,90410,81910,73636,55512,85623,45625,8649,29214,97746,56213,02823,19129,9488,72514,47433,64016,66727,10027,30014,28430,14214,39925,18614,44830i22525,463Developing countries: Total 29,6489,34933,295147,239228,732276,234301,423321,531323,149By area:AfricaAsia 2EuropeMiddle EastWestern Hemisphere1,7863,7932691,1832,6162,1102,7723811,8052,2823,9628,1292,6809,4369,0897,73444,4905,35964,09425,56312,053128,82615,53537,95634,36114,587157,53515,82341,77746,51213,095164,41715,17143,87764,86113,452175,19116,32145,15571,41213,230176,55716,37145,29671,696Memo:Oil-exporting countriesNon-oil developing countries1,6997,9492,0307,3199,95623,33967,16380,07643,875184,85748,883227,35145,871255,55245,534275,99745,280277,8691 Includes data for Luxembourg.2 Includes data for Taiwan Province <strong>of</strong> China.Note.—International reserves is comprised <strong>of</strong> monetary authorities' holdings <strong>of</strong> gold (at SDR 35 per ounce), special drawing rights(SDRs), reserve positions in <strong>the</strong> International Monetary Fund, and foreign exchange. Data exclude U.S.S.R., o<strong>the</strong>r Eastern Europeancountries, and Cuba (after 1960).U.S. dollars per SDR (end <strong>of</strong> period) are: 1952 and 1962—1.00000; 1972—1.08571; 1982—1.10311; 1990—1.42266; 1991—1.43043; 1992—1.37500; October 1993—1.39293; and November 1993—1.38389.Source: International Monetary Fund, International Financial Statistics.391
- Page 1:
S : Sf:' ;: W^W't-^WW': ;, S 4 Si :
- Page 5:
unitedminds
- Page 9 and 10:
Economic Report of the PresidentTo
- Page 11:
the Technology Reinvestment Project
- Page 14:
formed health care system, increase
- Page 19 and 20:
CONTENTSPageCHAPTER 1. A STRATEGY F
- Page 21:
PageProviding Comprehensive Benefit
- Page 24 and 25:
LIST OF CHARTS—CONTINUEDPage3-5 L
- Page 27 and 28:
CHAPTER 1A Strategy for Growth and
- Page 29 and 30:
which have left consumers and busin
- Page 31 and 32:
that growth in both real compensati
- Page 33 and 34:
for inflation was on average roughl
- Page 35 and 36:
Box 1-2.—Saving, Investment, and
- Page 37 and 38:
investments in human capital; inves
- Page 39 and 40:
of the income distribution (Table 1
- Page 41 and 42:
Box 1-3.—Credible Deficit Reducti
- Page 43 and 44:
Chart 1-7 Correlation of Investment
- Page 45 and 46:
Box 1~4*~-A Balanced Budget Amendme
- Page 47 and 48:
This educational record is not good
- Page 49 and 50:
fallen markedly since the 1960s (Ch
- Page 51 and 52:
The development and deployment of n
- Page 53 and 54:
Earlier rounds of GATT talks had fo
- Page 55 and 56:
Chart 1-10 Projected Real Growth Ra
- Page 57 and 58:
are therefore on the public dole. M
- Page 59:
prise communities and be granted sm
- Page 62 and 63:
ingredient that should allow the ec
- Page 64 and 65:
Chart 2-2 National Defense Purchase
- Page 66 and 67:
Chart 2-3 Growth of U.S. Merchandis
- Page 68 and 69:
Chart 2-5 Households: Credit Market
- Page 70 and 71:
THE HEADWINDS ARE MOSTLY CALMINGAs
- Page 72 and 73:
1993, real consumer spending increa
- Page 74 and 75:
RESIDENTIAL INVESTMENTResidential i
- Page 76 and 77:
smallest annual increase in 20 year
- Page 78 and 79:
ments with the Internal Revenue Ser
- Page 80 and 81:
safe-harbor rules for underpayment
- Page 82 and 83:
Chart 2-9 Alternative Measures of t
- Page 84 and 85:
Meanwhile, the Mountain States were
- Page 86 and 87:
inflation is measured by the Blue C
- Page 88 and 89:
Saving, Investment, and Capital Acc
- Page 90 and 91:
the future should be reflected in l
- Page 92 and 93:
Chart 2-15 Dynamic Effects of Defic
- Page 94 and 95:
joyed healthy average real GDP grow
- Page 96 and 97:
Chart 2-16 Personal Income Taxes as
- Page 98 and 99:
TABLE 2-2.— Administration Foreca
- Page 100 and 101:
TABLE 2-3.— Accounting for Growth
- Page 103 and 104:
CHAPTER 3Trends and Recent Developm
- Page 105 and 106:
first quarter of 1991, nonfarm payr
- Page 107 and 108:
cause defense cutbacks have caused
- Page 109 and 110:
UNEMPLOYMENT AND NONEMPLOYMENTThe U
- Page 111 and 112:
Chart 3-3 Civilian Unemployment Rat
- Page 113 and 114:
Chart 3-6 Employment-to-Population
- Page 115 and 116:
Chart 3-8 Ratio of White-Collar to
- Page 117 and 118:
than would be expected given its hi
- Page 119 and 120:
that the natural rate is falling? M
- Page 121 and 122:
SLOW INCOME GROWTHIncome trends hav
- Page 123 and 124:
Chart 3-10 Average Annual Growth of
- Page 125 and 126:
Box 3-3.—Consequences of Producti
- Page 127 and 128:
likely that immigration could expla
- Page 129 and 130:
We do, however, know how many worke
- Page 131 and 132:
size. No data are available on vola
- Page 133 and 134:
BENEFITSOne of the concerns raised
- Page 135 and 136:
edented partnership to develop a nu
- Page 137 and 138:
CHAPTER 4Health Care ReformTHE UNIT
- Page 139 and 140:
make cost-conscious decisions. In a
- Page 141 and 142:
A third rationale for universal cov
- Page 143 and 144:
Box 4-1.—Moral Hazard and Adverse
- Page 145 and 146:
ies depending on one's health statu
- Page 147 and 148:
than people in other countries do,
- Page 149 and 150:
sumers are ill equipped to bring st
- Page 151 and 152:
By itself, the aging of the populat
- Page 153 and 154:
TABLE 4-3.- Sources and Uses of Hea
- Page 155 and 156:
about 65 to 70 cents for a typical
- Page 157 and 158:
THE ARCHITECTURE OF THE HEALTHSECUR
- Page 159 and 160:
etary savings for the Federal Gover
- Page 161 and 162:
contribution, within limits. Outsid
- Page 163 and 164:
salary income, payments from the em
- Page 165 and 166:
TABLE 4-6.—Caps on Premiums by Fi
- Page 167 and 168:
An example will illustrate the proc
- Page 169 and 170:
TABLE 4-9.—Sources and Uses of Fe
- Page 171 and 172:
Chart 4-9 Business Spending on Heal
- Page 173:
Health care reform should set the s
- Page 176 and 177:
and private sectors, addressing env
- Page 178 and 179:
Box 5-1.—Selected National Perfor
- Page 180 and 181:
Box 5-2*—Market PowerFirms are sa
- Page 182 and 183:
ate regulation. For example, State
- Page 184 and 185:
competitiveness of U.S. industry, a
- Page 186 and 187:
Box 5-4.—ExternalitiesAn external
- Page 188 and 189:
in the habitat of the spotted owl r
- Page 190 and 191:
CLIMATE CHANGE ACTION PLANCertain g
- Page 192 and 193:
eral, lays a foundation for broader
- Page 194 and 195:
The Administration's proposal seeks
- Page 196 and 197:
vances in technical know-how have a
- Page 198 and 199:
Investments in R&D are risky. Like
- Page 200 and 201:
1950s and 1960s, and American compa
- Page 202 and 203:
ico and Lawrence Livermore in Calif
- Page 204 and 205:
of industry. MOCs will be affiliate
- Page 206 and 207:
tiveness. Again, the hoped-for resu
- Page 208 and 209:
forts to cut the massive Federal bu
- Page 210 and 211:
TECHNOLOGY POLICY, GROWTH, ANDCOMPE
- Page 212 and 213:
mitment to an open international tr
- Page 214 and 215:
ses, which take such intersectoral
- Page 216 and 217:
An important sectoral development i
- Page 218 and 219:
TABLE 6-3.—Stock of U.S. Outward
- Page 220 and 221:
technical change has been offered a
- Page 222 and 223:
ent account is a broader measure of
- Page 224 and 225:
TABLE 6-6.—Intrafirm Trade as Sha
- Page 226 and 227:
greater access to the Japanese mark
- Page 228 and 229:
the transparency of its trade regim
- Page 230 and 231:
that if the states of the former So
- Page 232 and 233:
Box 6-3.—Mexican Economic Reforms
- Page 234 and 235:
1998, while nontariff barriers on a
- Page 236 and 237:
ward convergence in environmental a
- Page 238 and 239:
Box 6-4.—The Asian "Miracle"Per c
- Page 240 and 241:
Box 6-5.—The Economic Impact of t
- Page 242 and 243:
development, and environmental clea
- Page 244 and 245:
THE TRADE POLICY AGENDABy lowering
- Page 246 and 247:
ignated monopolies. It also establi
- Page 248 and 249:
The dollar ended 1993 roughly where
- Page 250 and 251:
Box 6-7.—Exchange-Rate Volatility
- Page 252 and 253:
Chart 6-5 French Franc-Deutsche Mar
- Page 254 and 255:
Besides bringing these endeavors to
- Page 257 and 258:
LETTER OF TRANSMITTALCOUNCIL OF ECO
- Page 259 and 260:
Report to the President on the Acti
- Page 261 and 262:
duction budget package, the North A
- Page 263 and 264:
Working Group studying cost-benefit
- Page 265 and 266:
prepares the Economic Indicators an
- Page 267:
Appendix BSTATISTICAL TABLES RELATI
- Page 270 and 271:
POPULATION, EMPLOYMENT, WAGES, AND
- Page 272 and 273:
AGRICULTURE:PageB-96. Farm income,
- Page 274 and 275:
NATIONAL INCOME OR EXPENDITURETABLE
- Page 276 and 277:
TABLE B-2.—Gross domestic product
- Page 278 and 279:
TABLE B-3.—Implicit price deflato
- Page 280 and 281:
TABLE B-4.—Fixed-weighted price i
- Page 282 and 283:
TABLE B-5.—Changes in gross domes
- Page 284 and 285:
TABLE B-7.—Cross domestic product
- Page 286 and 287:
TABLE B-9.—Gross domestic product
- Page 288 and 289:
TABLE B-ll.—Gross domestic produc
- Page 290 and 291:
TABLE B-13.—Gross domestic produc
- Page 292 and 293:
TABLE B-15.—Personal consumption
- Page 294 and 295:
TABLE B-17.—Gross and net private
- Page 296 and 297:
TABLE B-19.—Inventories and final
- Page 298 and 299:
TABLE B-21.—Foreign transactions
- Page 300 and 301:
TABLE B-23.—Relation of gross dom
- Page 302 and 303:
TABLE B-25.—National income by ty
- Page 304 and 305:
TABLE B-26.—Sources of personal i
- Page 306 and 307:
TABLE B-27.—Disposition of person
- Page 308 and 309:
TABLE B-29.—Gross sating and inve
- Page 310 and 311:
TABLE B-31.—Median money income (
- Page 312 and 313:
TABLE B-33.—Population and the la
- Page 314 and 315:
TABLE B-34.—Civilian employment a
- Page 316 and 317:
TABLE B-36.—Unemployment by demog
- Page 318 and 319:
TABLE B-38.—Civilian labor force
- Page 320 and 321:
TABLE B-40.—Civilian unemployment
- Page 322 and 323:
TABLE B-42.—Unemployment by durat
- Page 324 and 325:
TABLE B-44.—Employees on nonagric
- Page 326 and 327:
TABLE B-45.—Hours and earnings in
- Page 328 and 329:
TABLE B-47.—Productivity and rela
- Page 330 and 331:
PRODUCTION AND BUSINESS ACTIVITYTAB
- Page 332 and 333:
TABLE B-51.—Industrial production
- Page 334 and 335:
TABLE B-53.—New construction acti
- Page 336 and 337:
TABLE B-54.—New housing units sta
- Page 338 and 339:
Year or monthTABLE B-56.—Manufact
- Page 340 and 341:
TABLE B-58.—Manufacturers' new an
- Page 342 and 343:
TABLE B-60.—Consumer price indexe
- Page 344 and 345:
TABLE B-61.—Consumer price indexe
- Page 346 and 347: TABLE B-63.—Changes in consumer p
- Page 348 and 349: TABLE B-64.—Producer price indexe
- Page 350 and 351: TABLE B-66.—Producer price indexe
- Page 352 and 353: TABLE B-67.—Changes in producer p
- Page 354 and 355: TABLE B-69.—Components of money s
- Page 356 and 357: TABLE B-70.—Aggregate reserves of
- Page 358 and 359: TABLE B-72.—Bond yields and inter
- Page 360 and 361: TABLE B-73.—Total funds raised in
- Page 362 and 363: TABLE B-74.—Mortgage debt outstan
- Page 364 and 365: TABLE B-76.—Consumer credit outst
- Page 366 and 367: TABLE B-78.—Federal receipts, out
- Page 368 and 369: TABLE B-79.—Federal budget receip
- Page 370 and 371: TABLE B-81.—Federal and State and
- Page 372 and 373: TABLE B-83.—State and local gover
- Page 374 and 375: TABLE B-85.—Interest-bearing publ
- Page 376 and 377: TABLE B-87.—Estimated ownership o
- Page 378 and 379: TABLE B-89.—Corporate profits by
- Page 380 and 381: TABLE B-91.—Sales, profits, and s
- Page 382 and 383: TABLE B-93.—Sources and uses of f
- Page 384 and 385: TABLE B-95.—Business formation an
- Page 386 and 387: 19481949195019511952195319541955195
- Page 388 and 389: TABLE B-99.—Indexes of prices rec
- Page 390 and 391: TABLE B-101.— Farm business balan
- Page 392 and 393: TABLE B-103.—U.S. international t
- Page 394 and 395: TABLE B-104.—U.S. merchandise exp
- Page 398 and 399: TABLE B-108.—Industrial productio
- Page 400 and 401: TABLE B-110.—Foreign exchange rat
- Page 402 and 403: NATIONAL WEALTHTABLE B-l 12.—Nati
- Page 404: SUPPLEMENTARY TABLETABLE B-114.—S